Marcin Mazureknarzędzia online · artykuły · księgarniaRSS
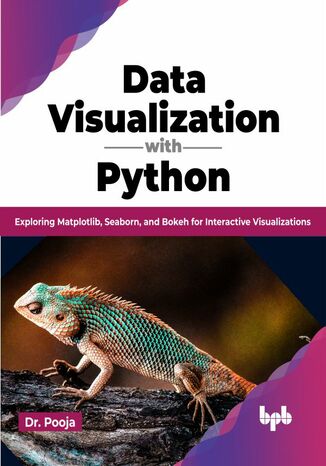
Okładka: Data Visualization with Python

Data Visualization with Python

Autor: Dr. Pooja

Helionebook

39,90 zł 84,99 zł -53%

Kup w księgarni Helion

Czytaj fragmentPobierz PDF

Kategorie
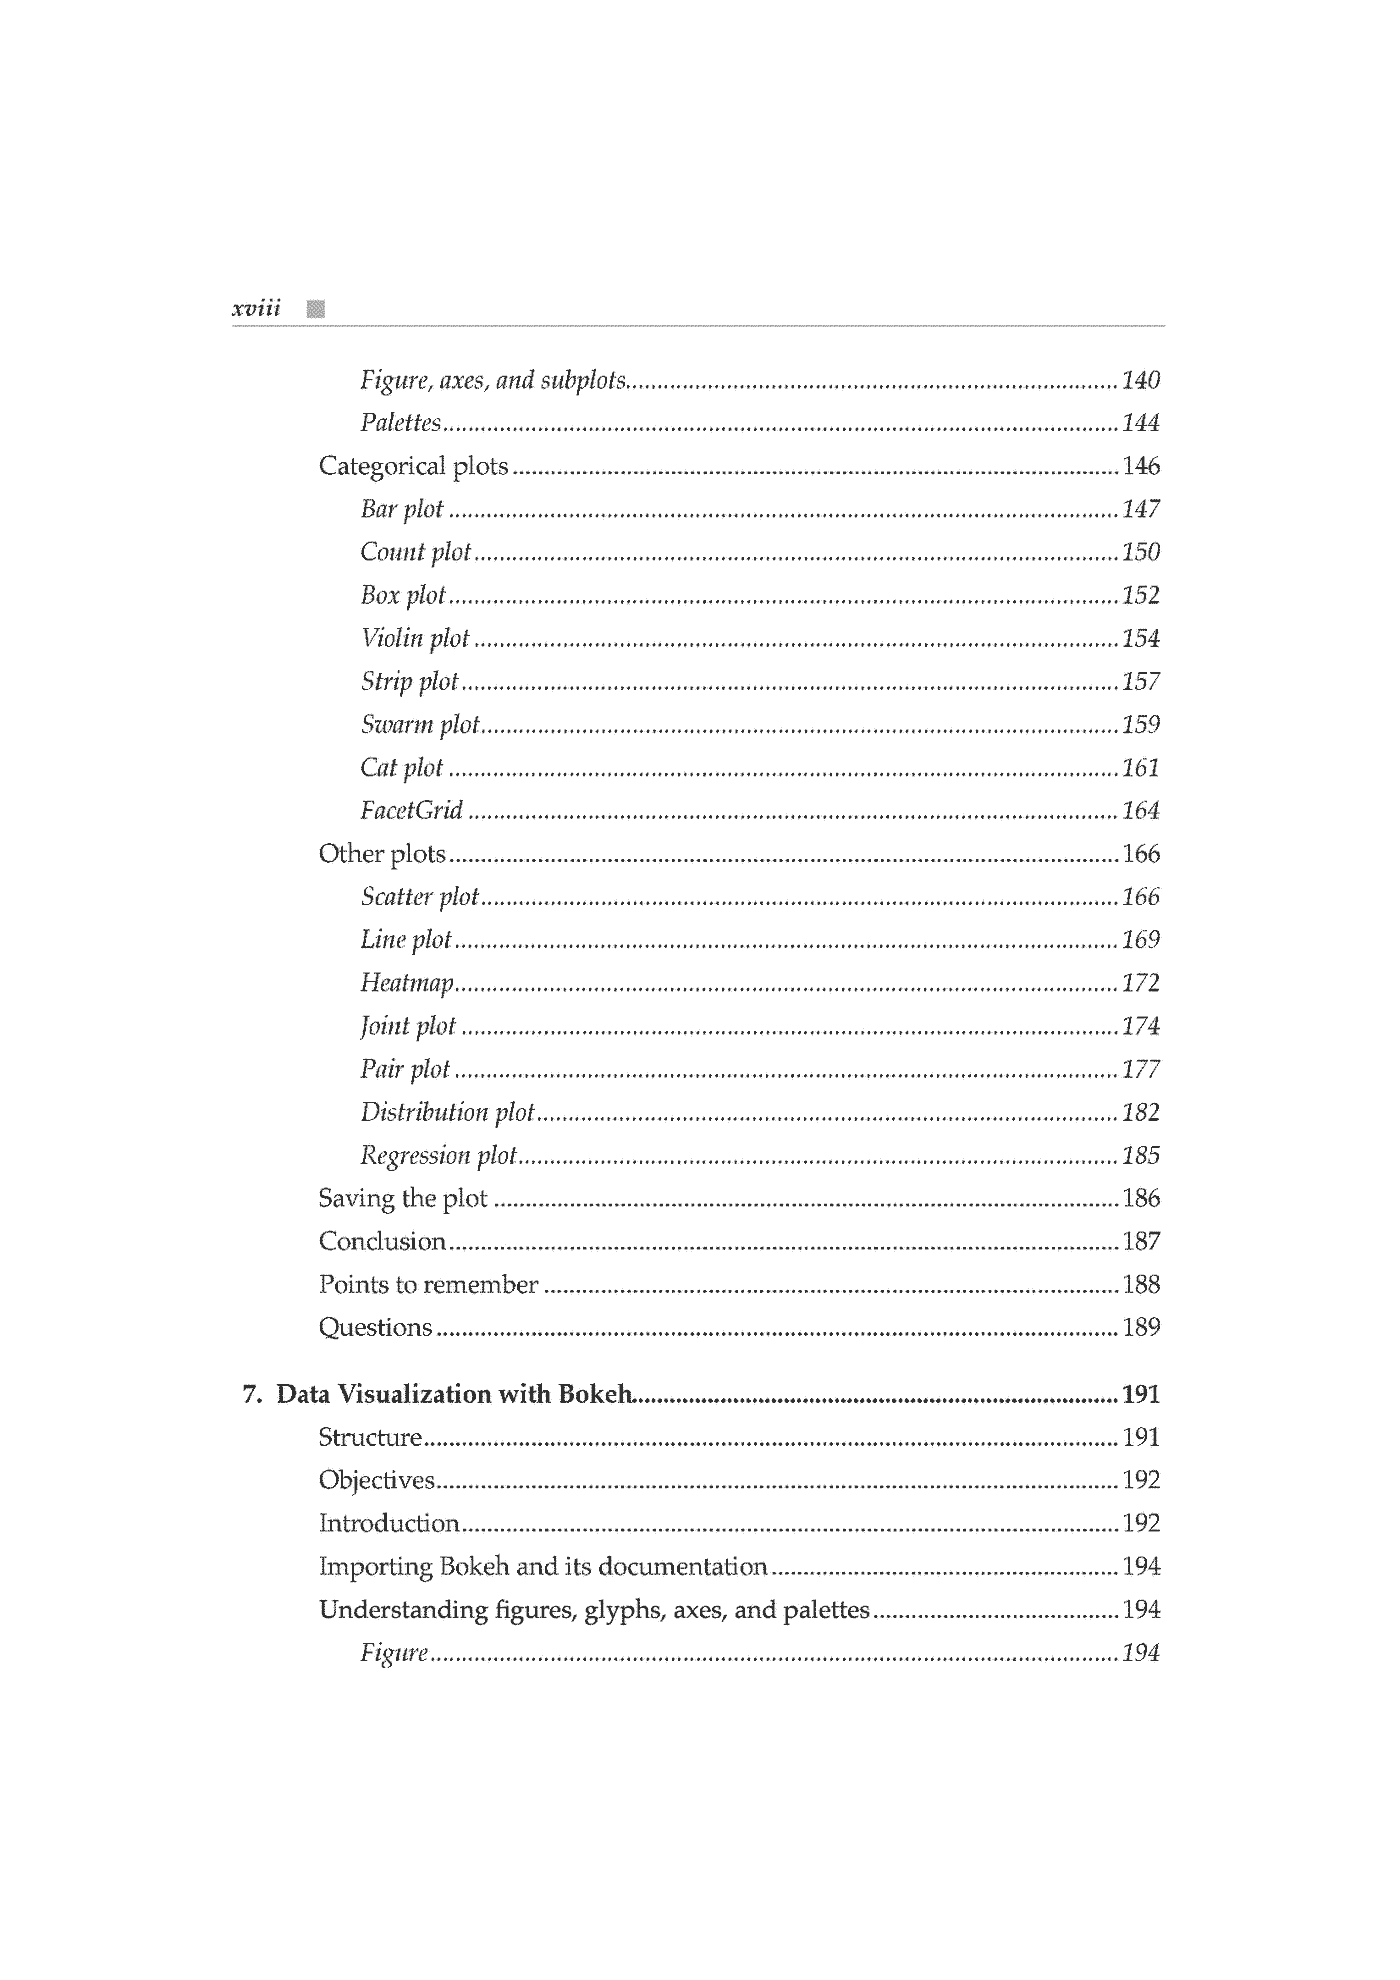
Python, Python w danych
Wydawca
BPB Publications
Rodzaj
ebook
Stron
304
Data wydania
2023-07-11
ISBN
9789355515384
Formaty
ePub (4,9MB) · Mobi (4,9MB)

Fragment książki — 30 stron

Kliknij stronę, żeby powiększyć. Całość możesz przeczytać online albo pobrać jako PDF. Fragment udostępniony przez wydawcę.

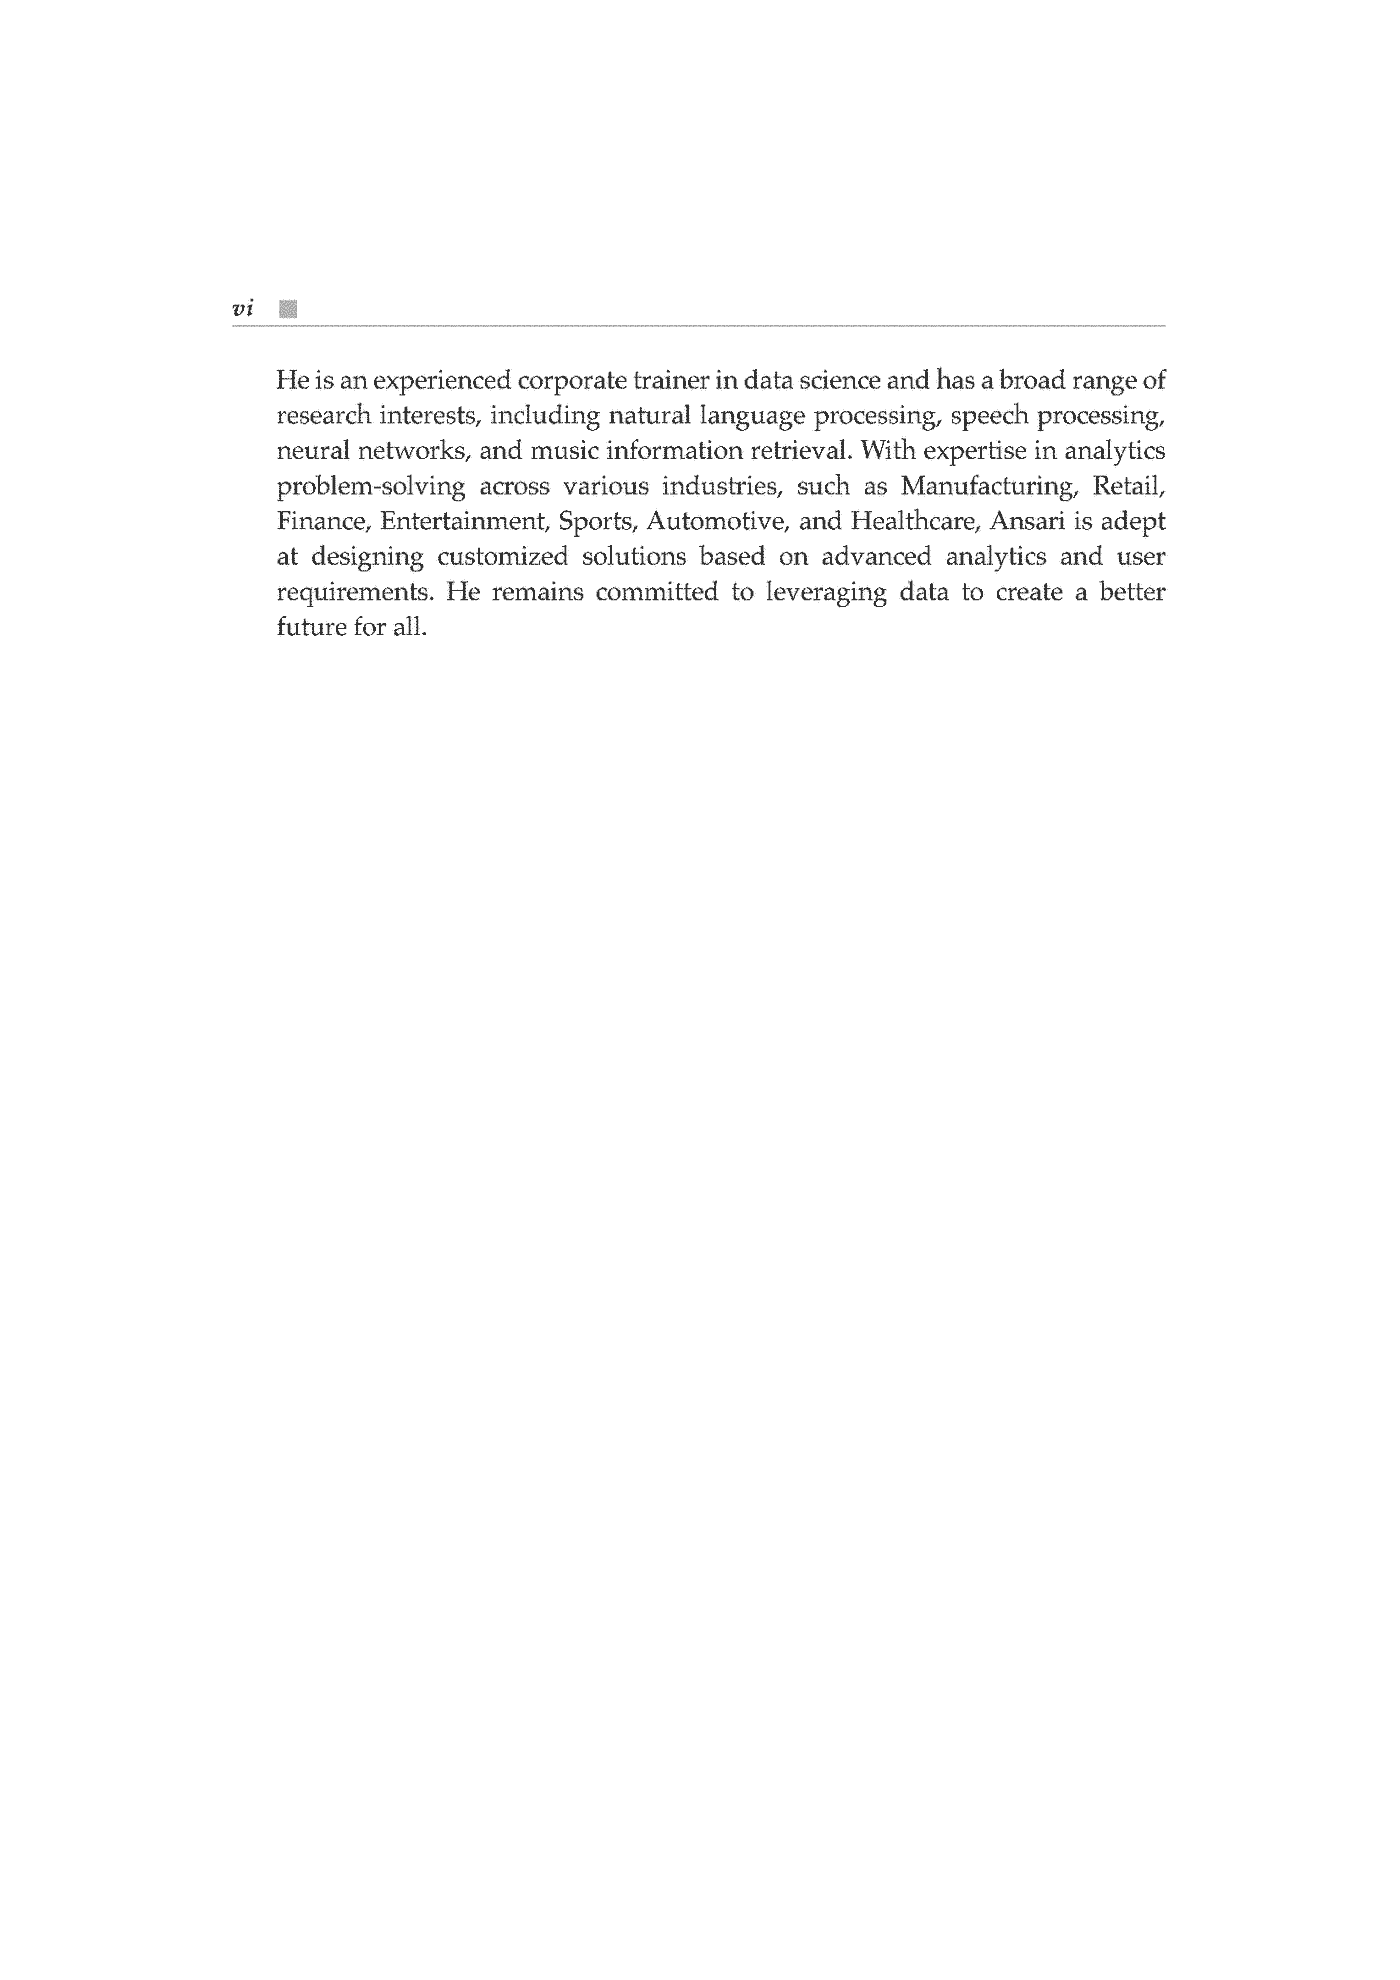
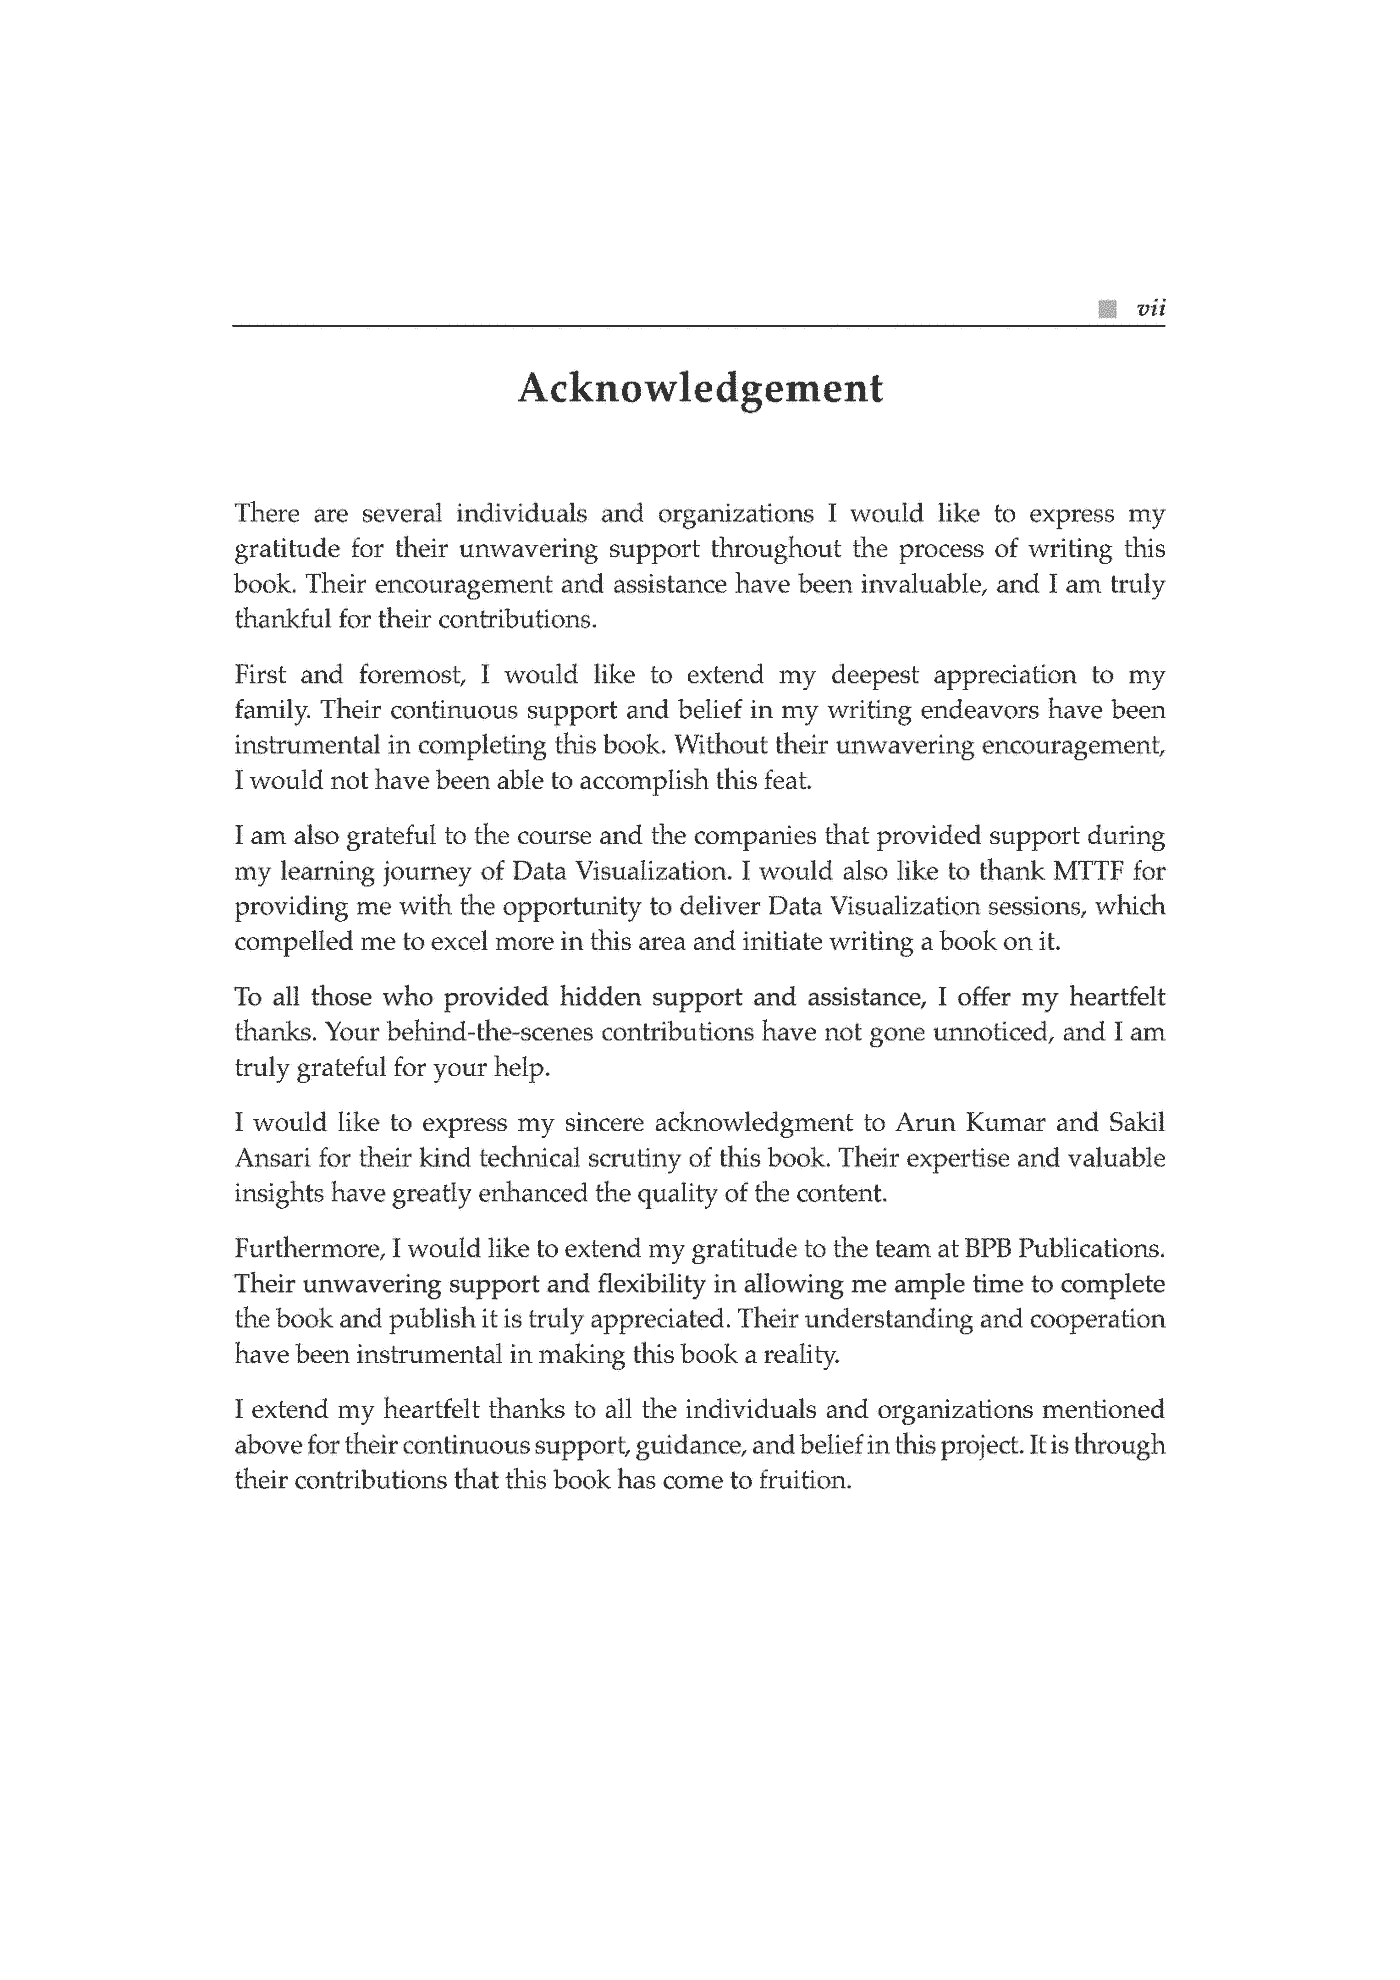
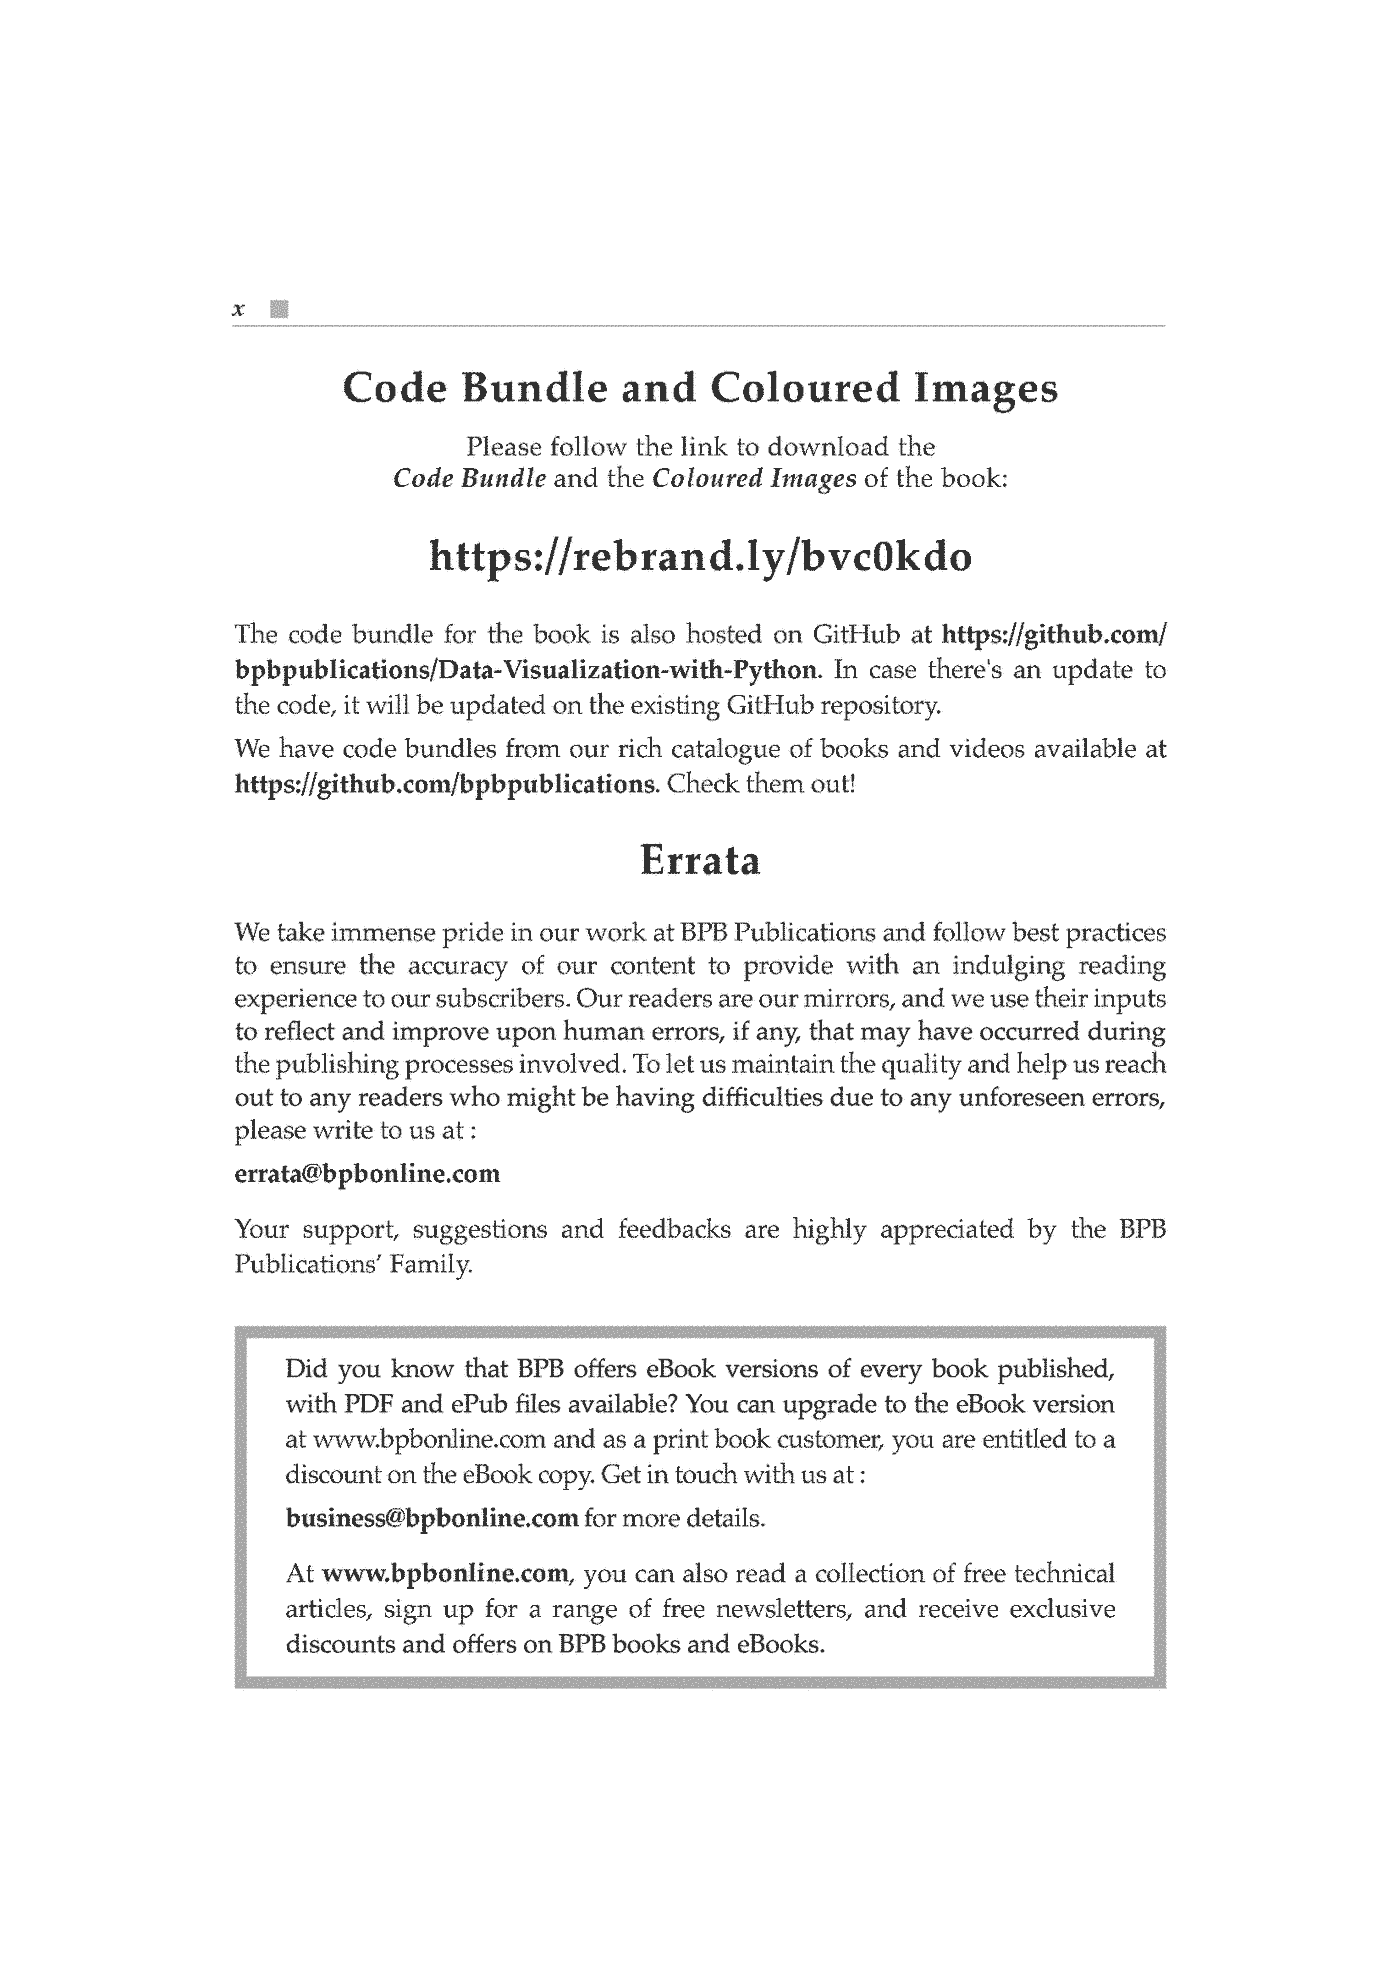
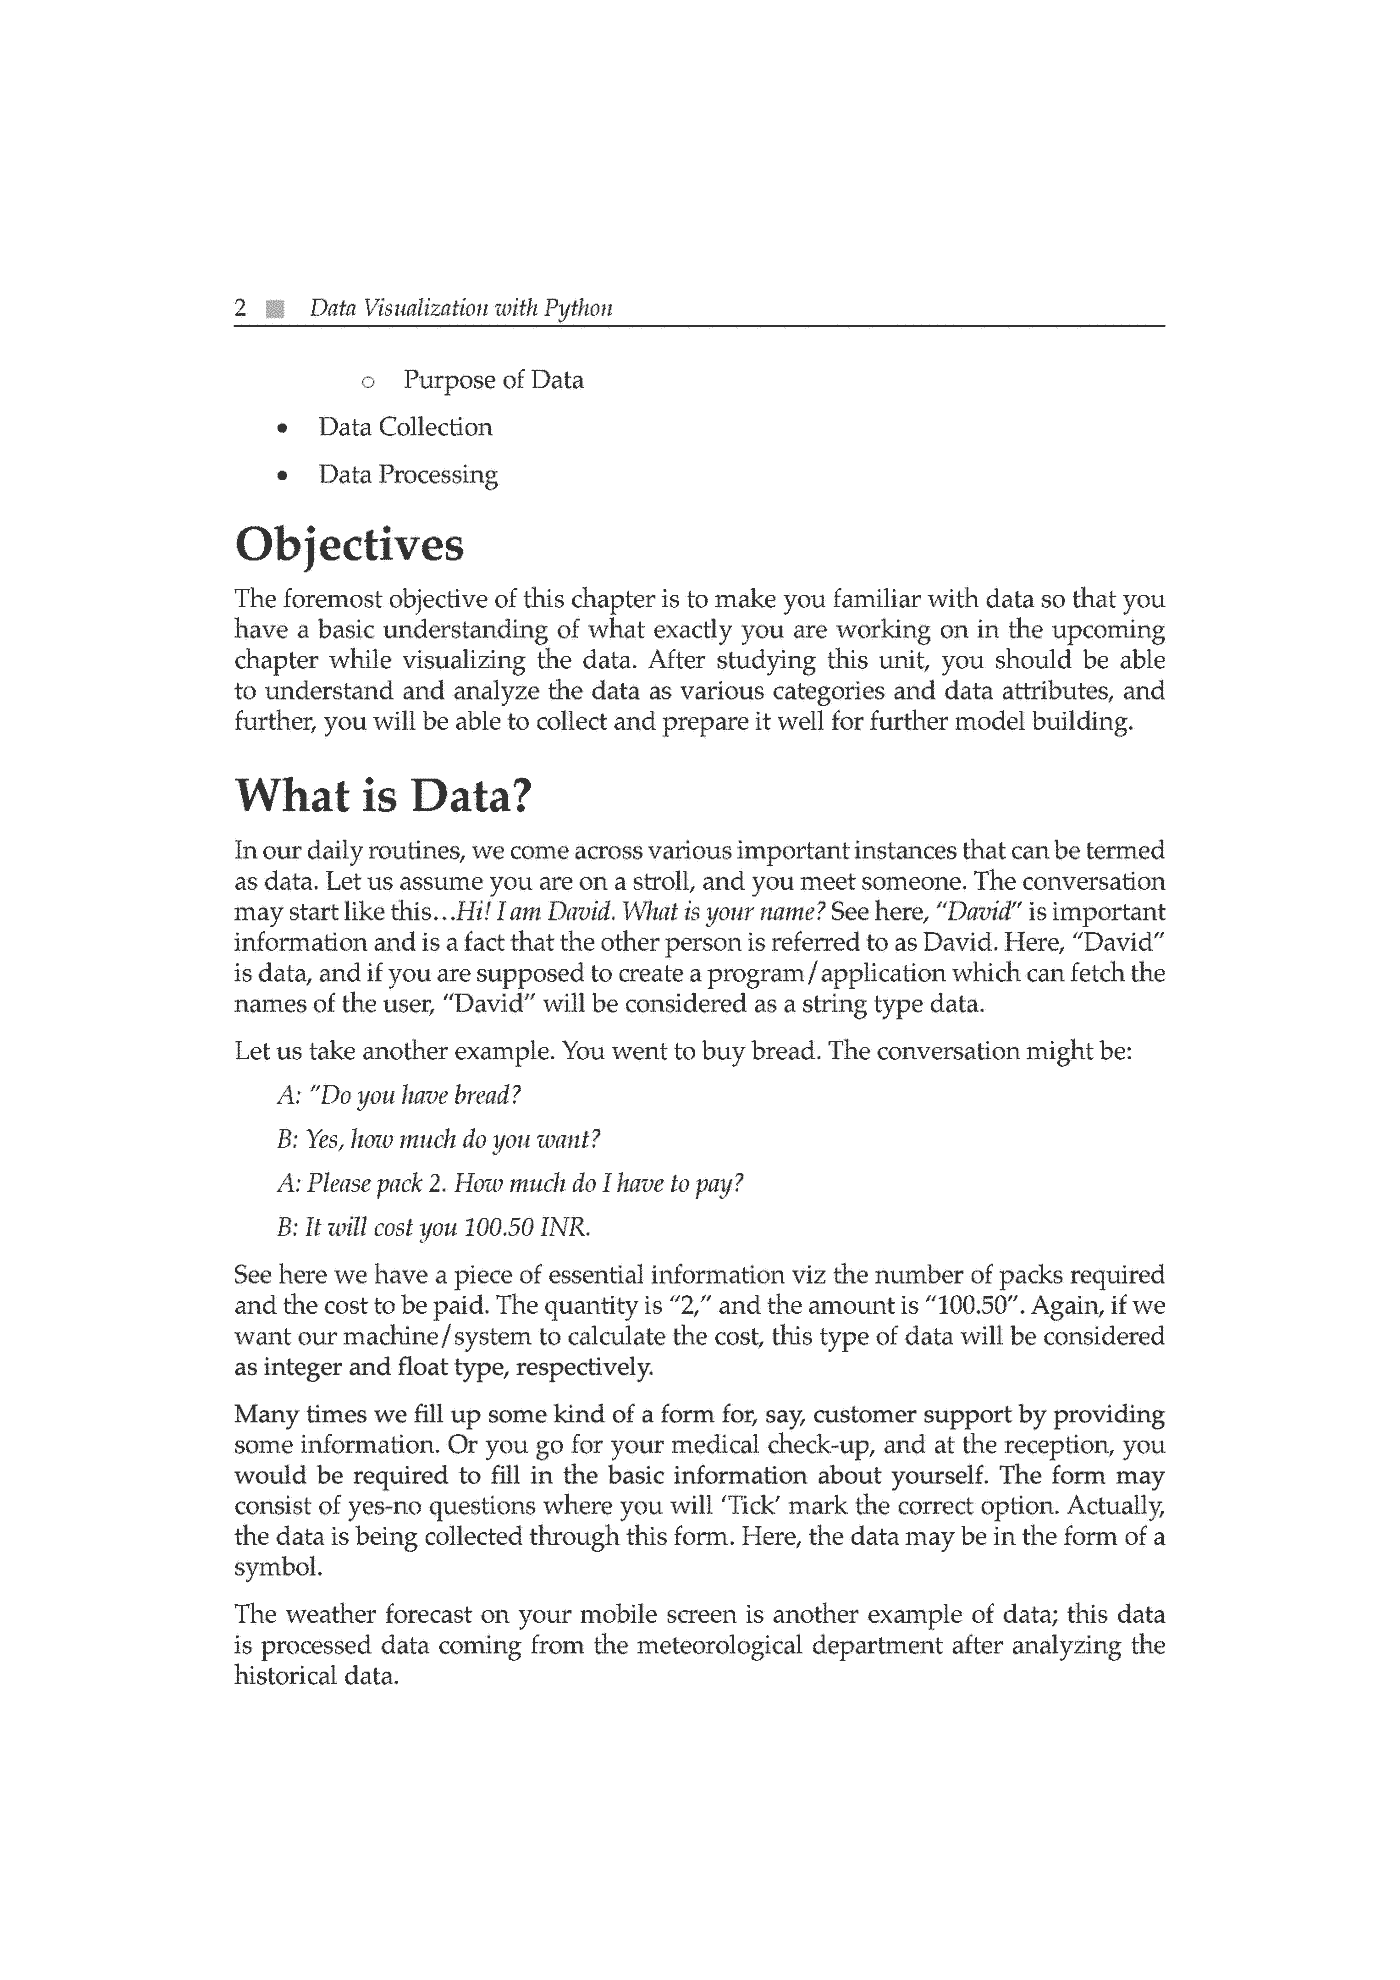
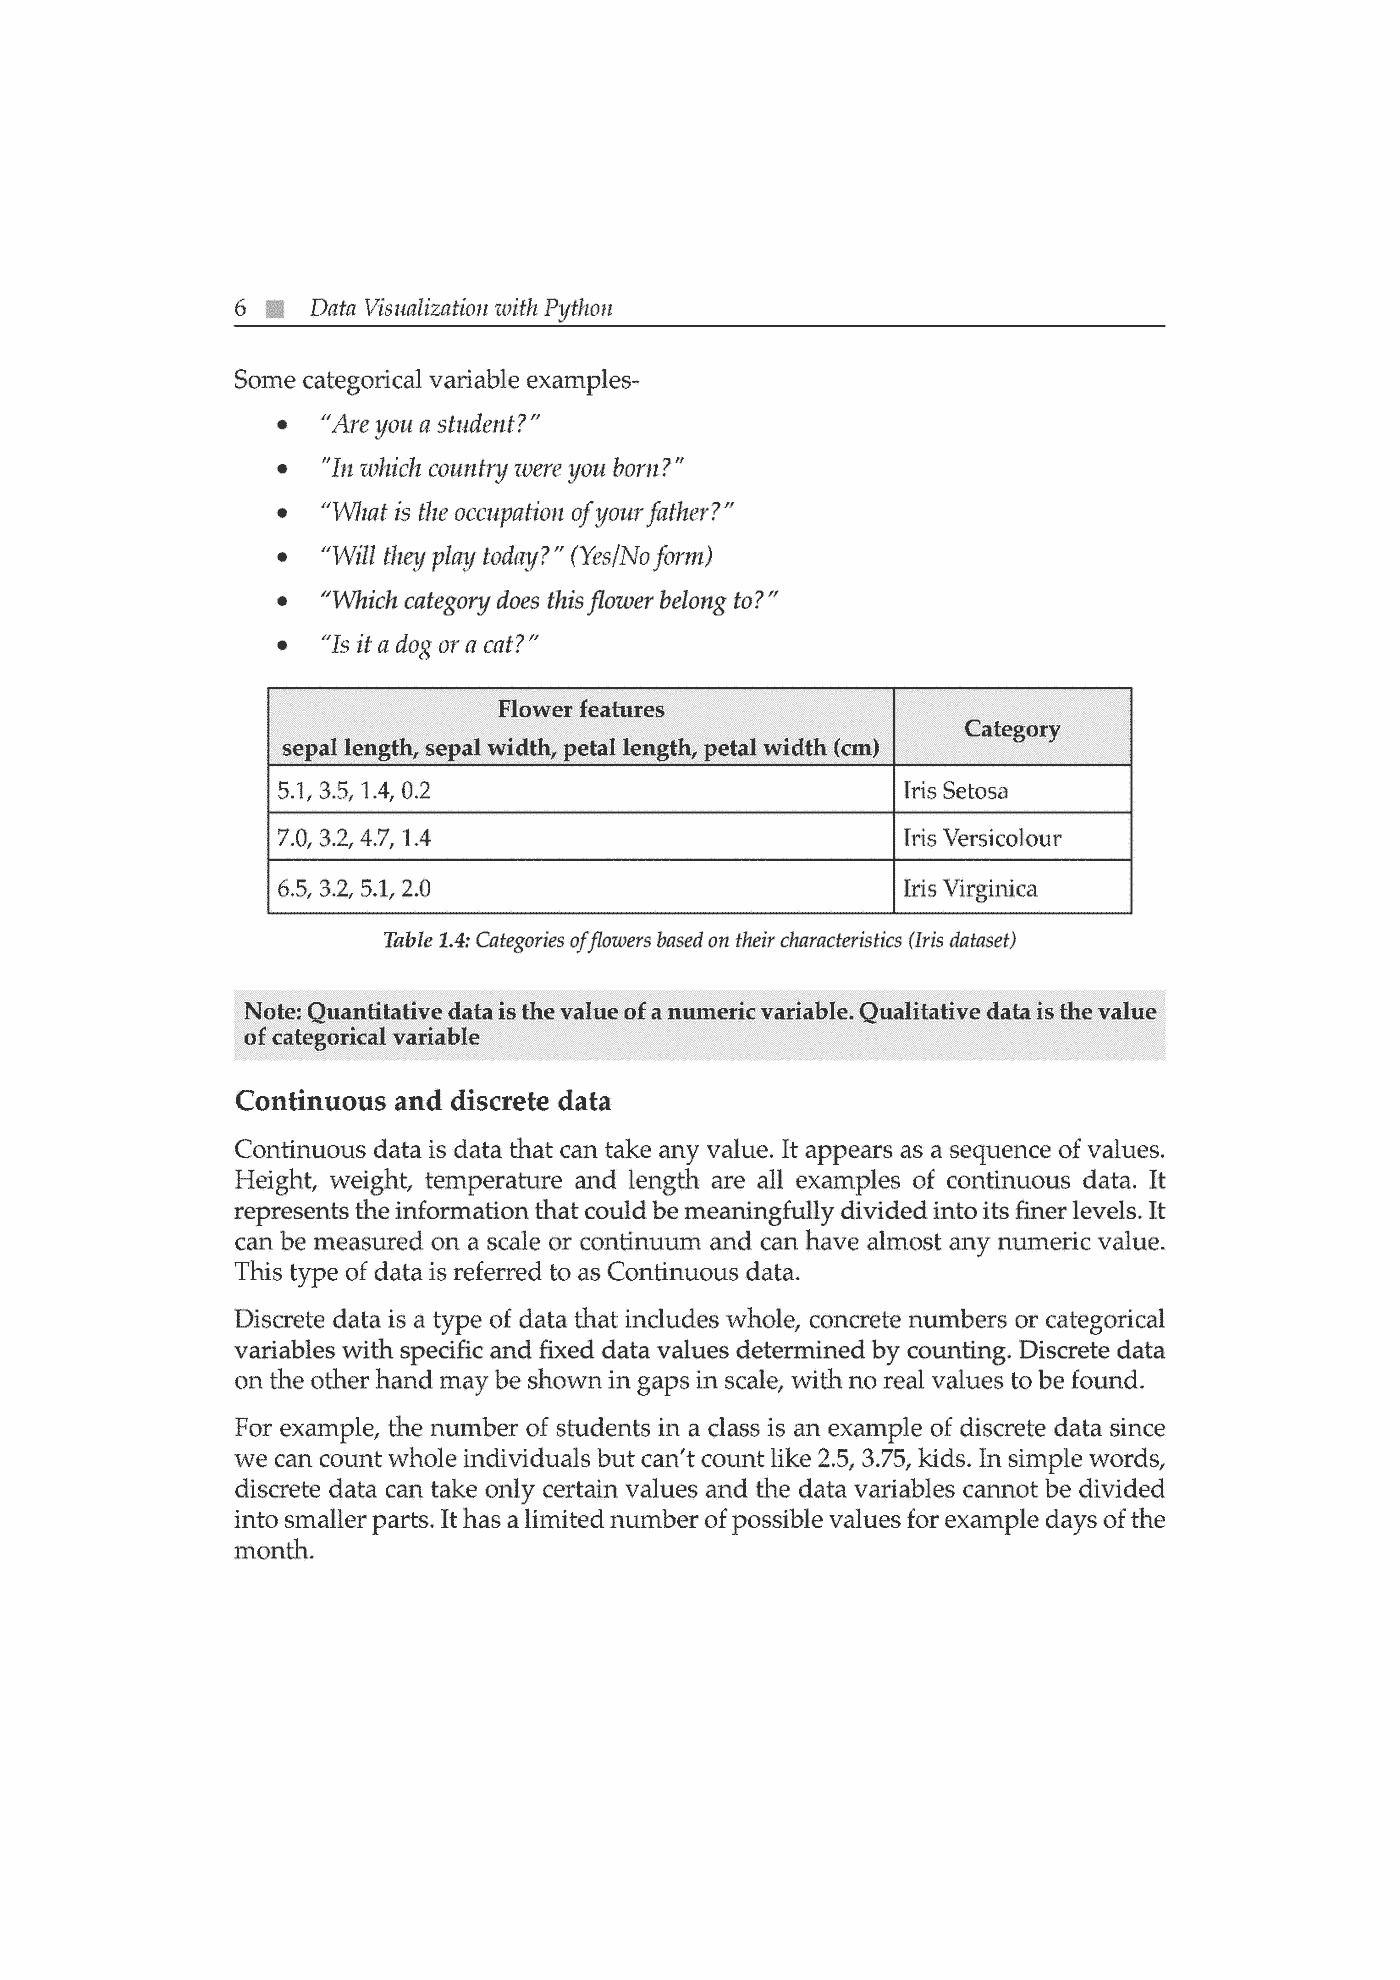
  • Fragment „Data Visualization with Python” — strona 1 z 301
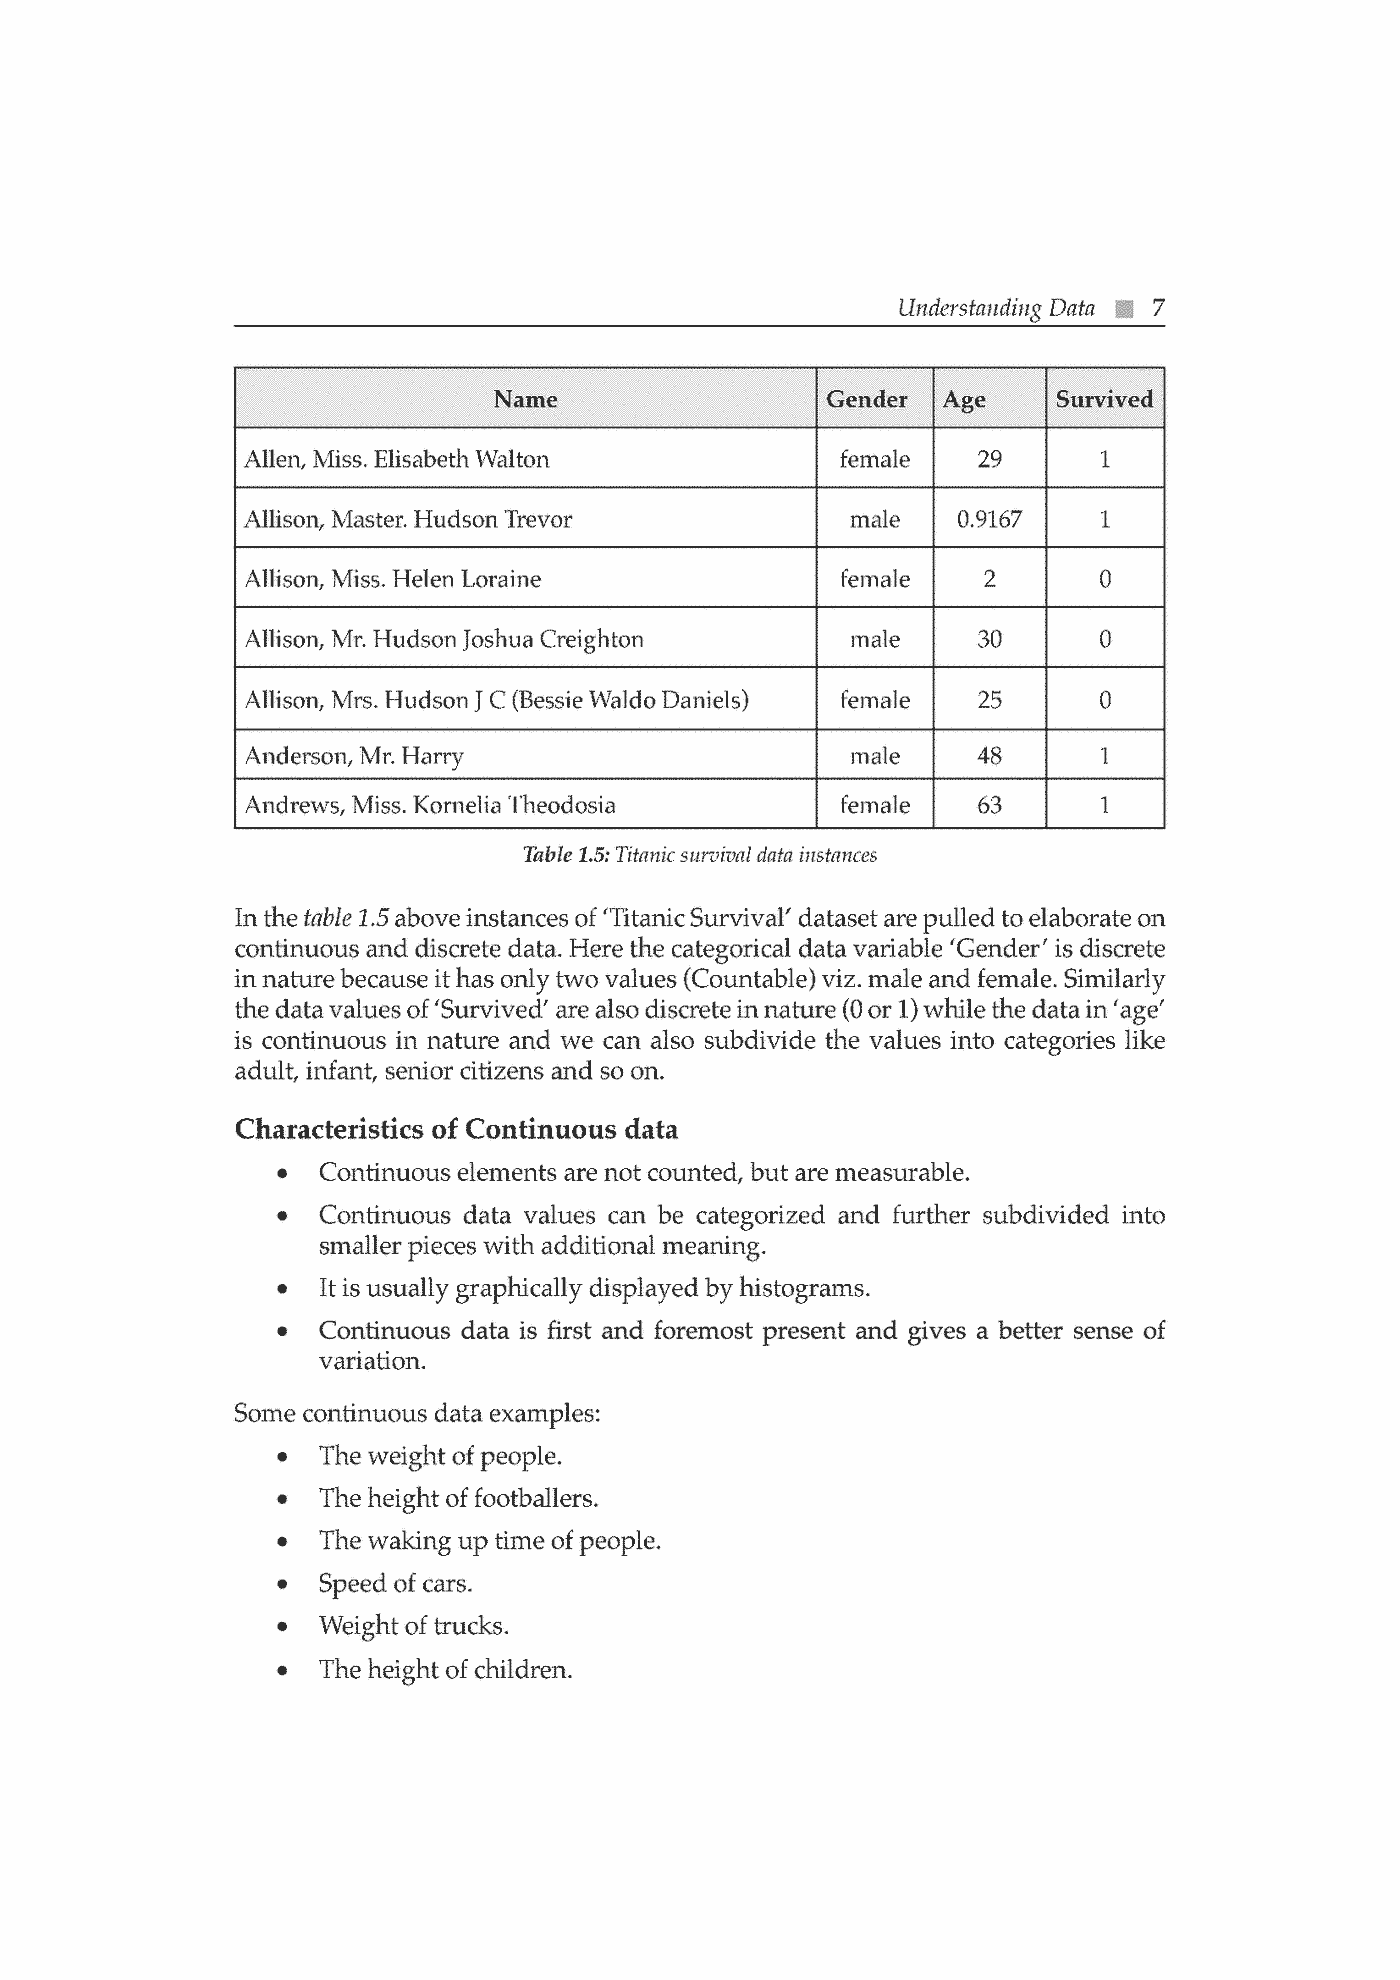
  • Fragment „Data Visualization with Python” — strona 2 z 302
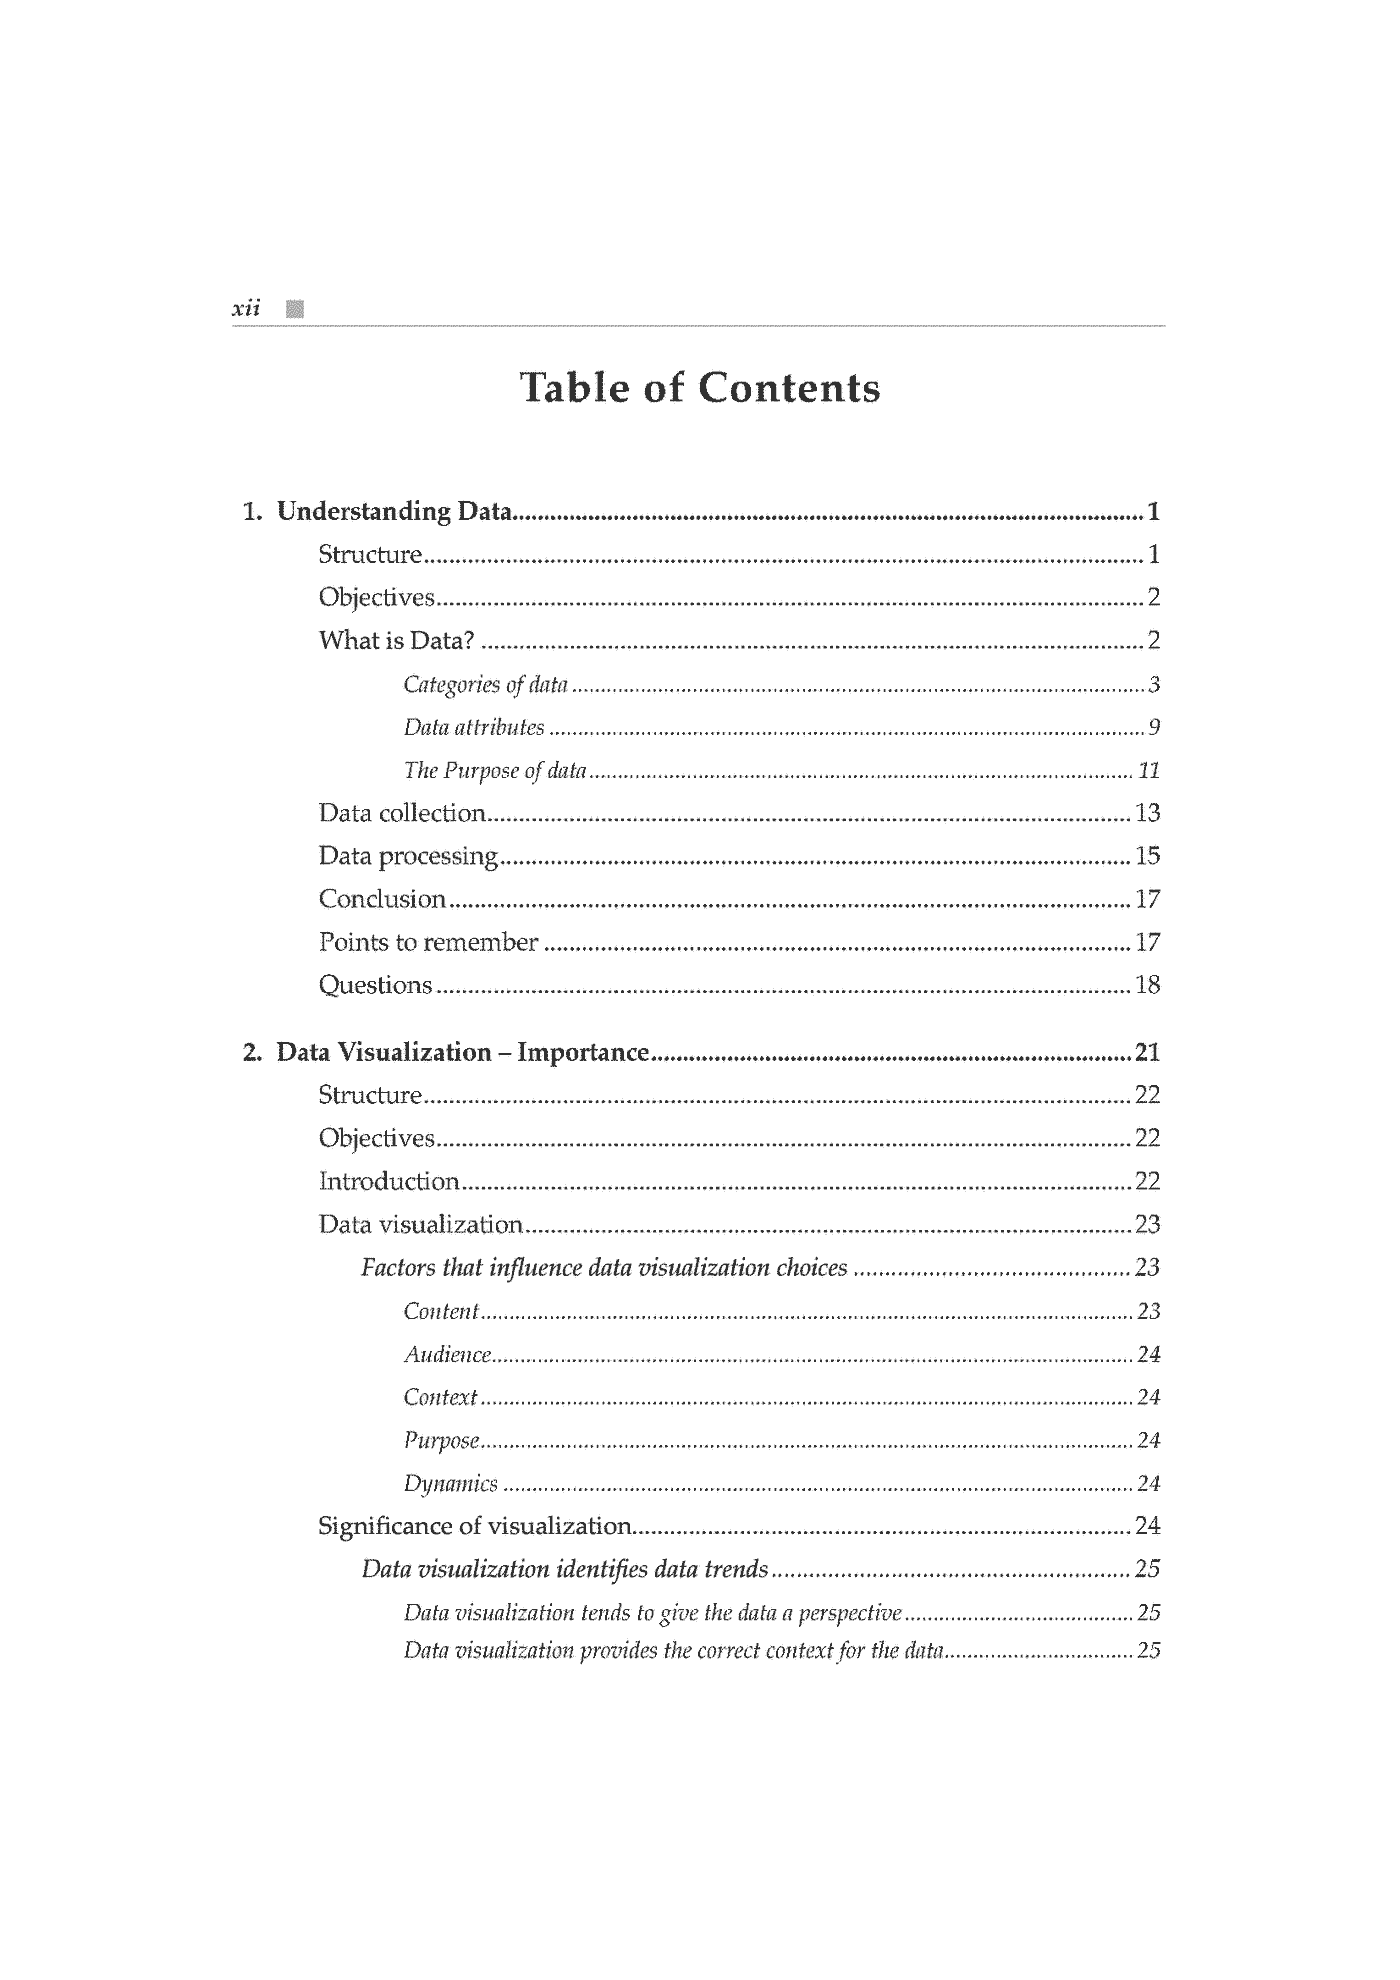
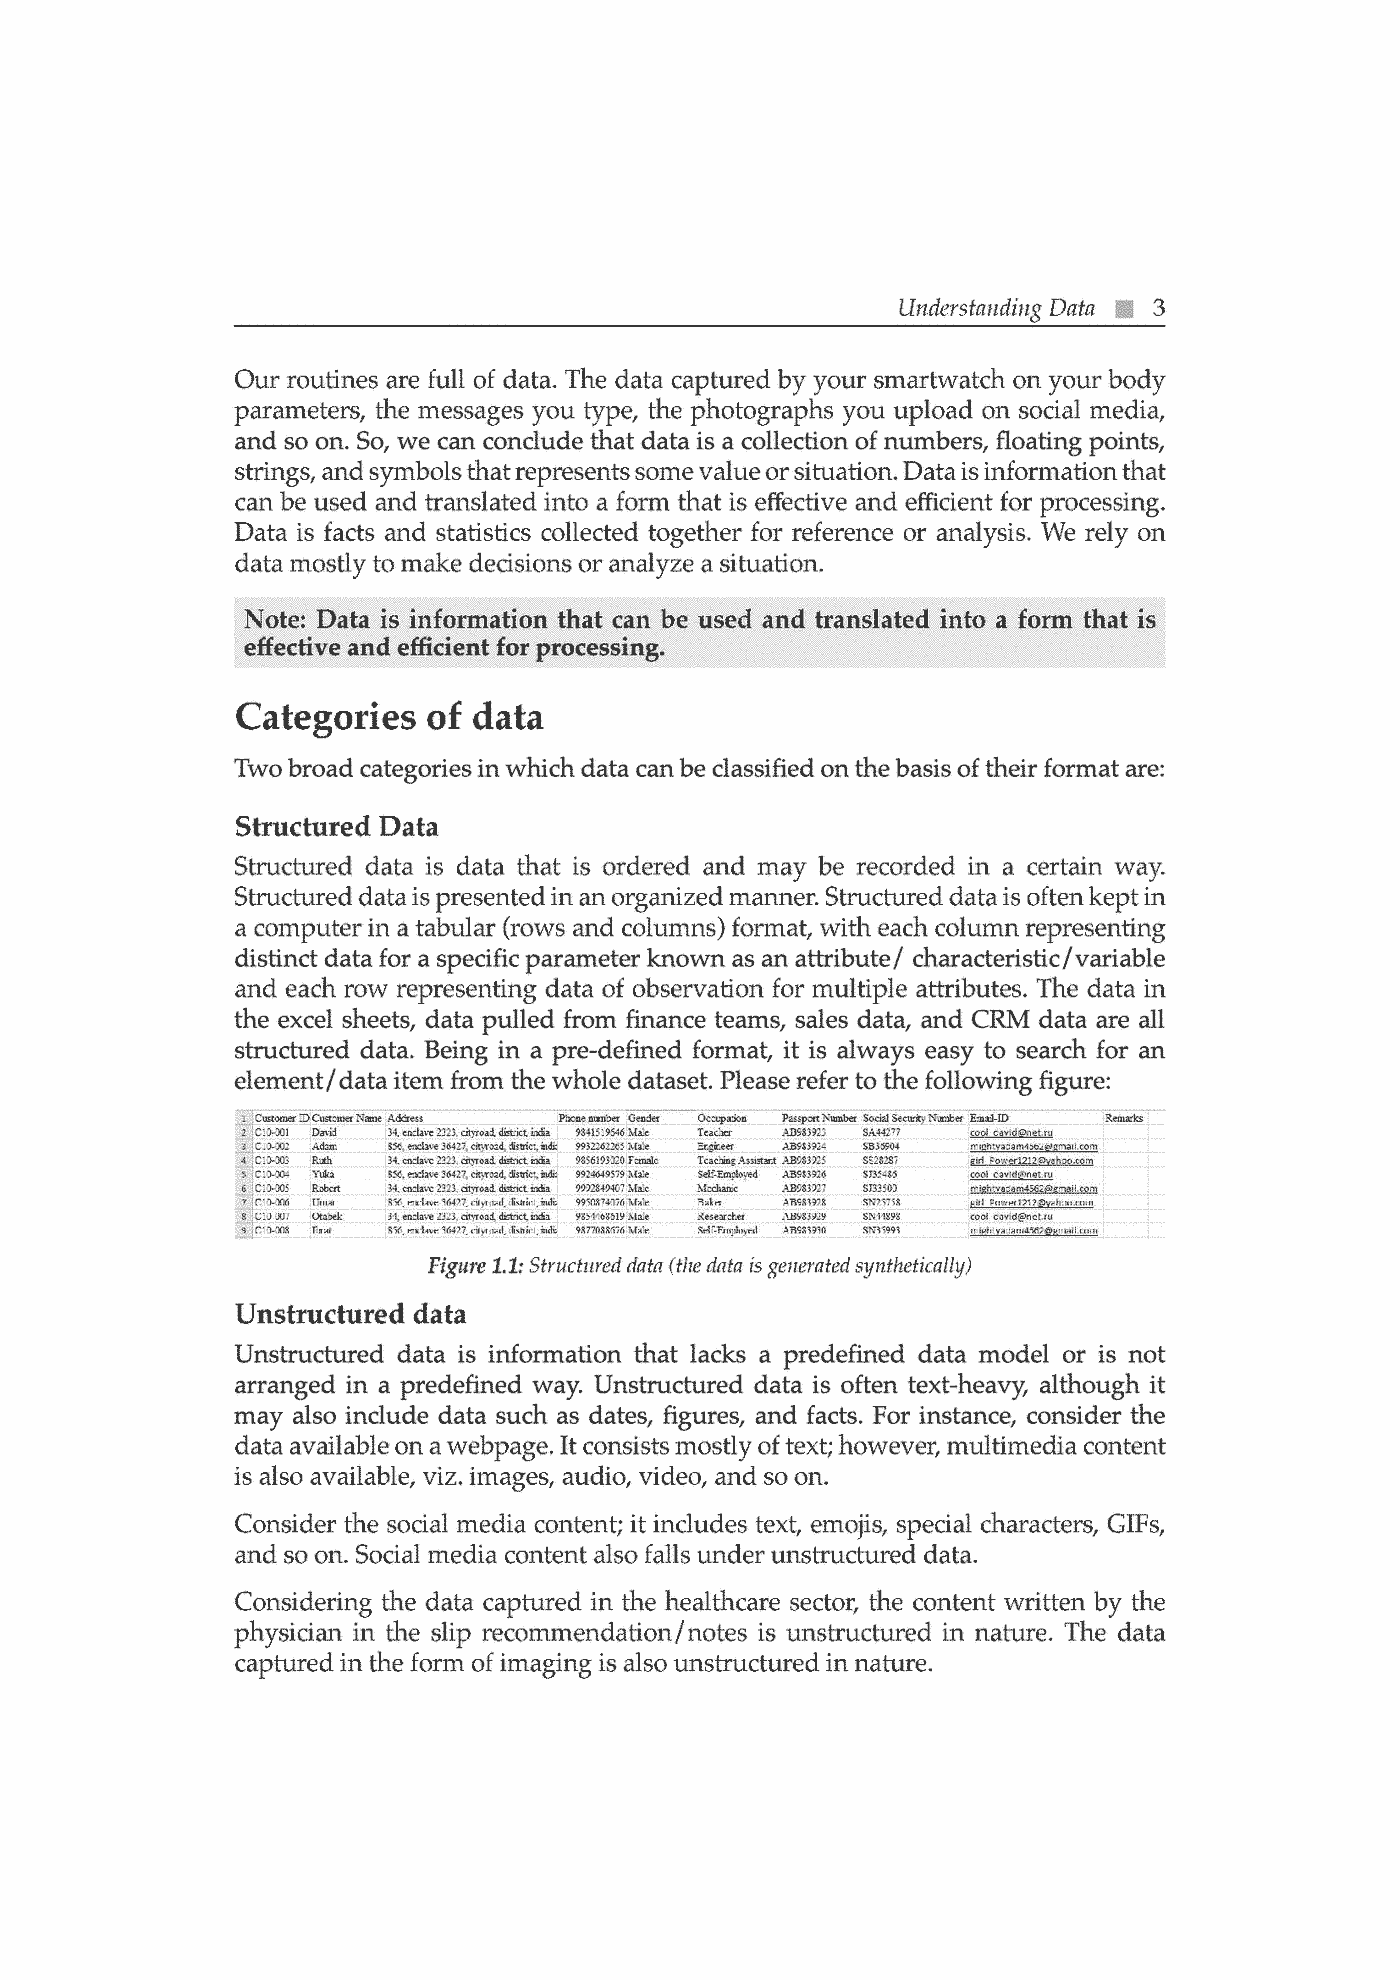
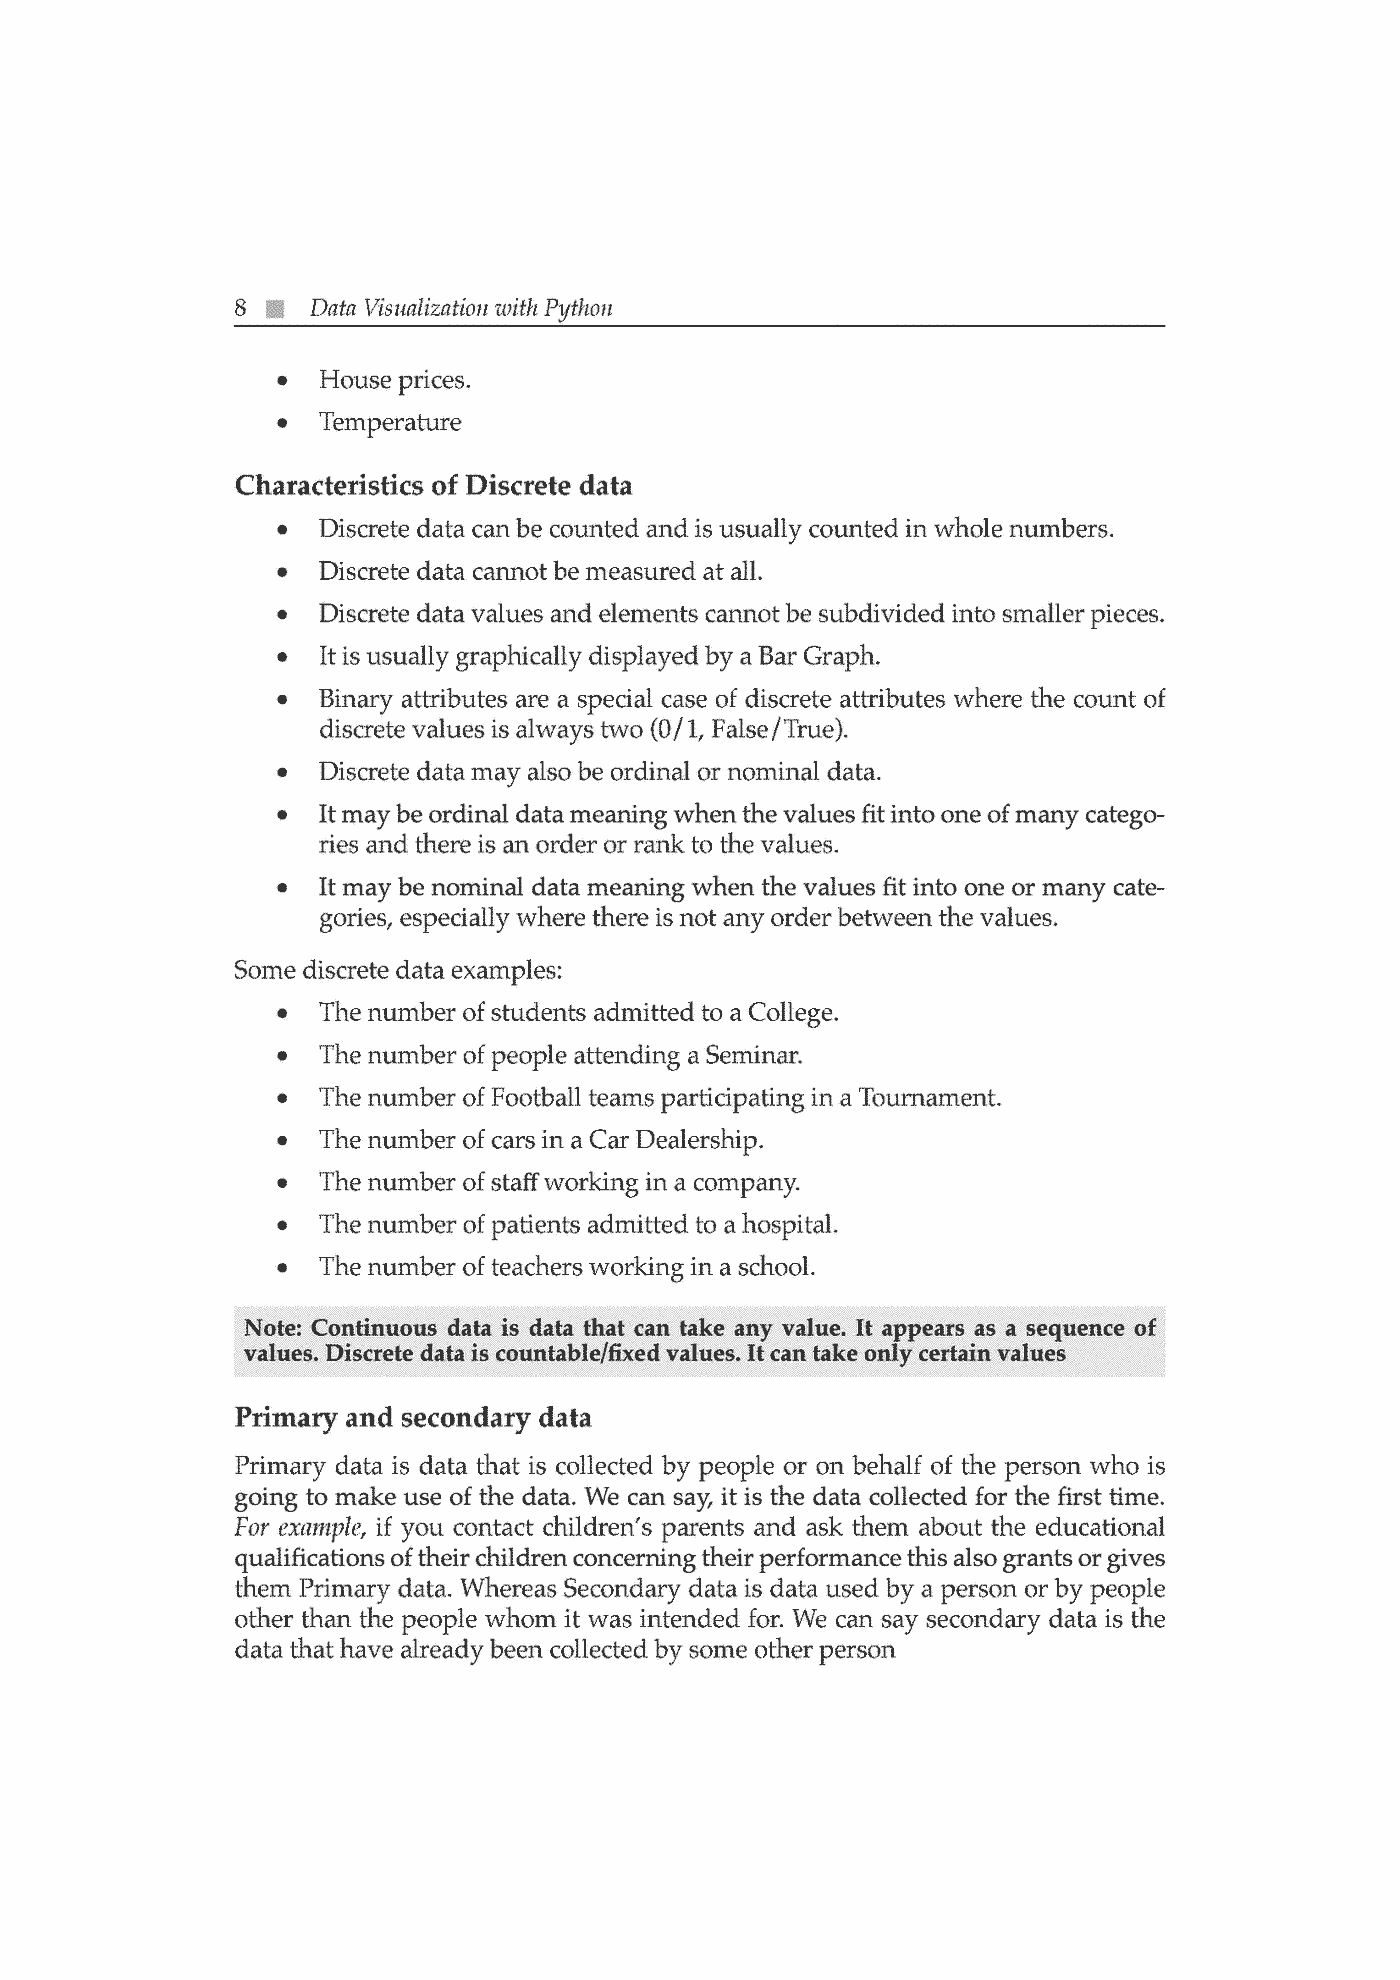
  • Fragment „Data Visualization with Python” — strona 3 z 303
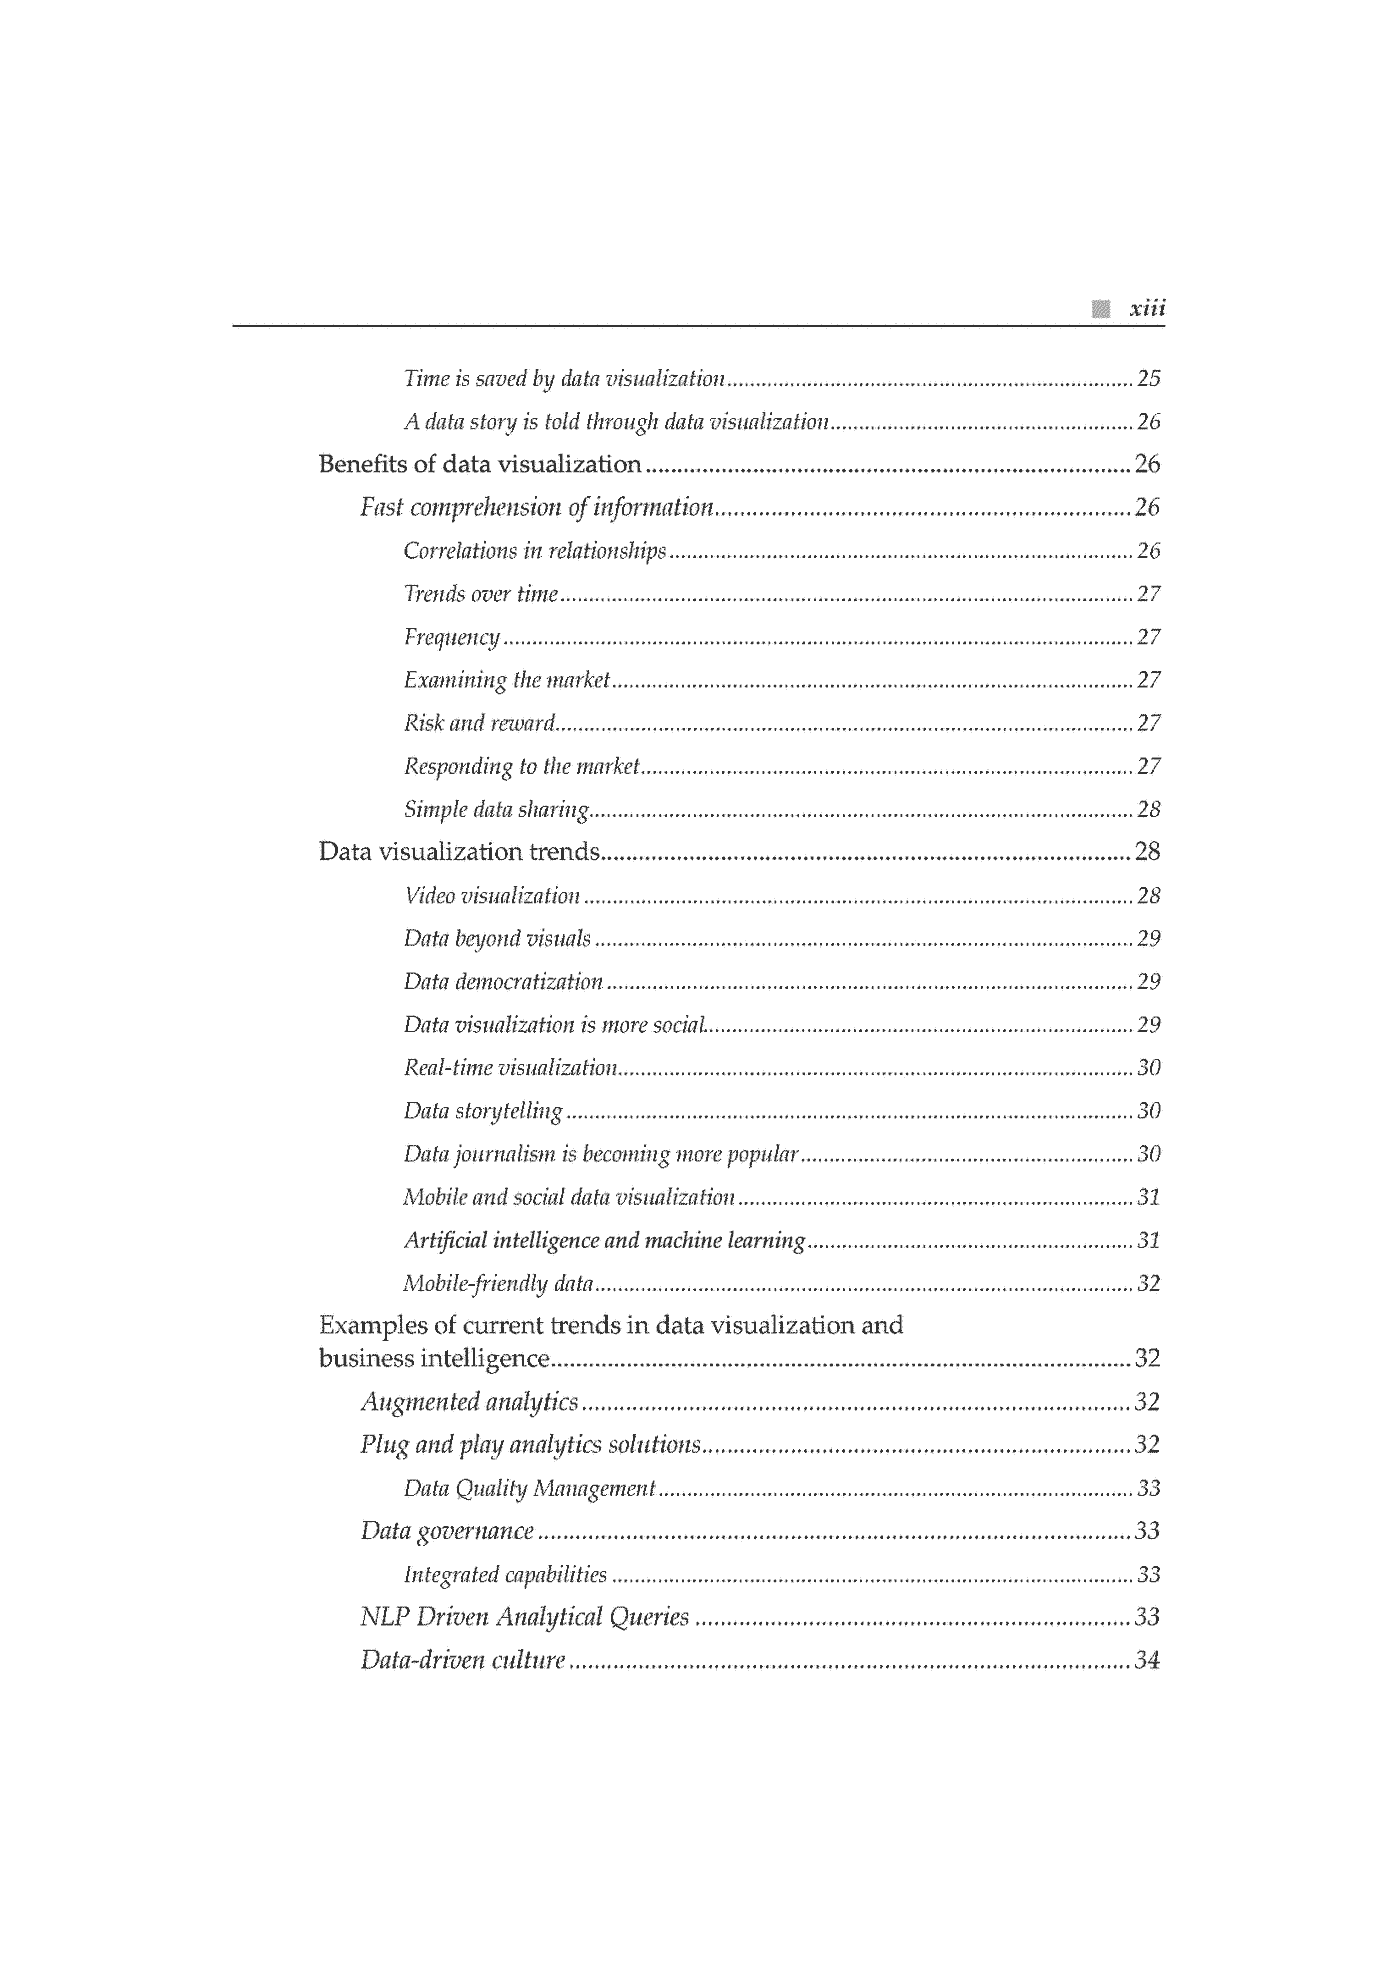
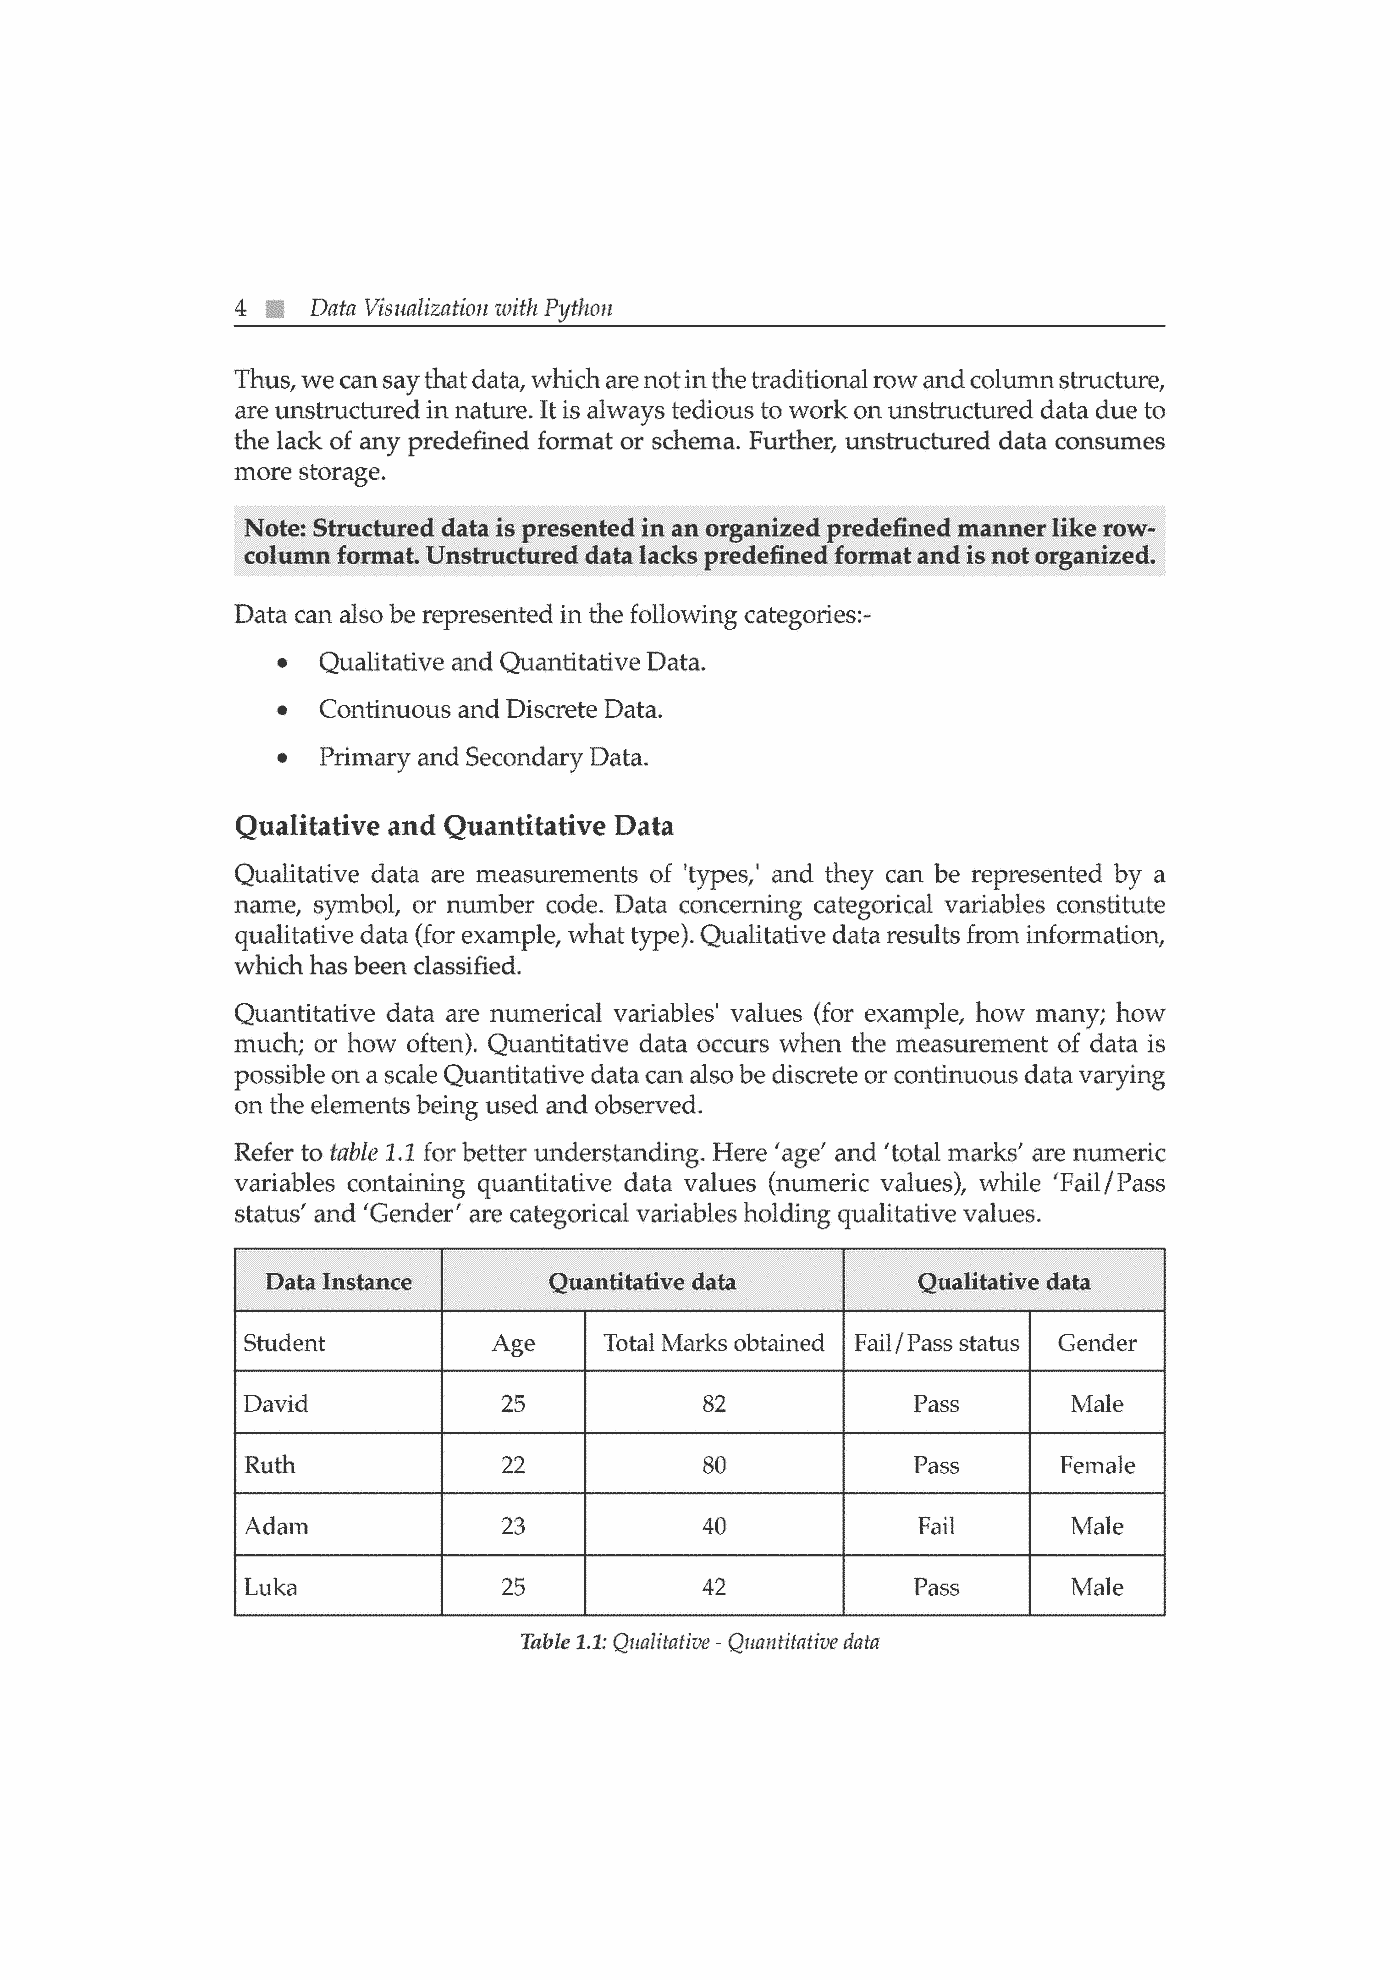
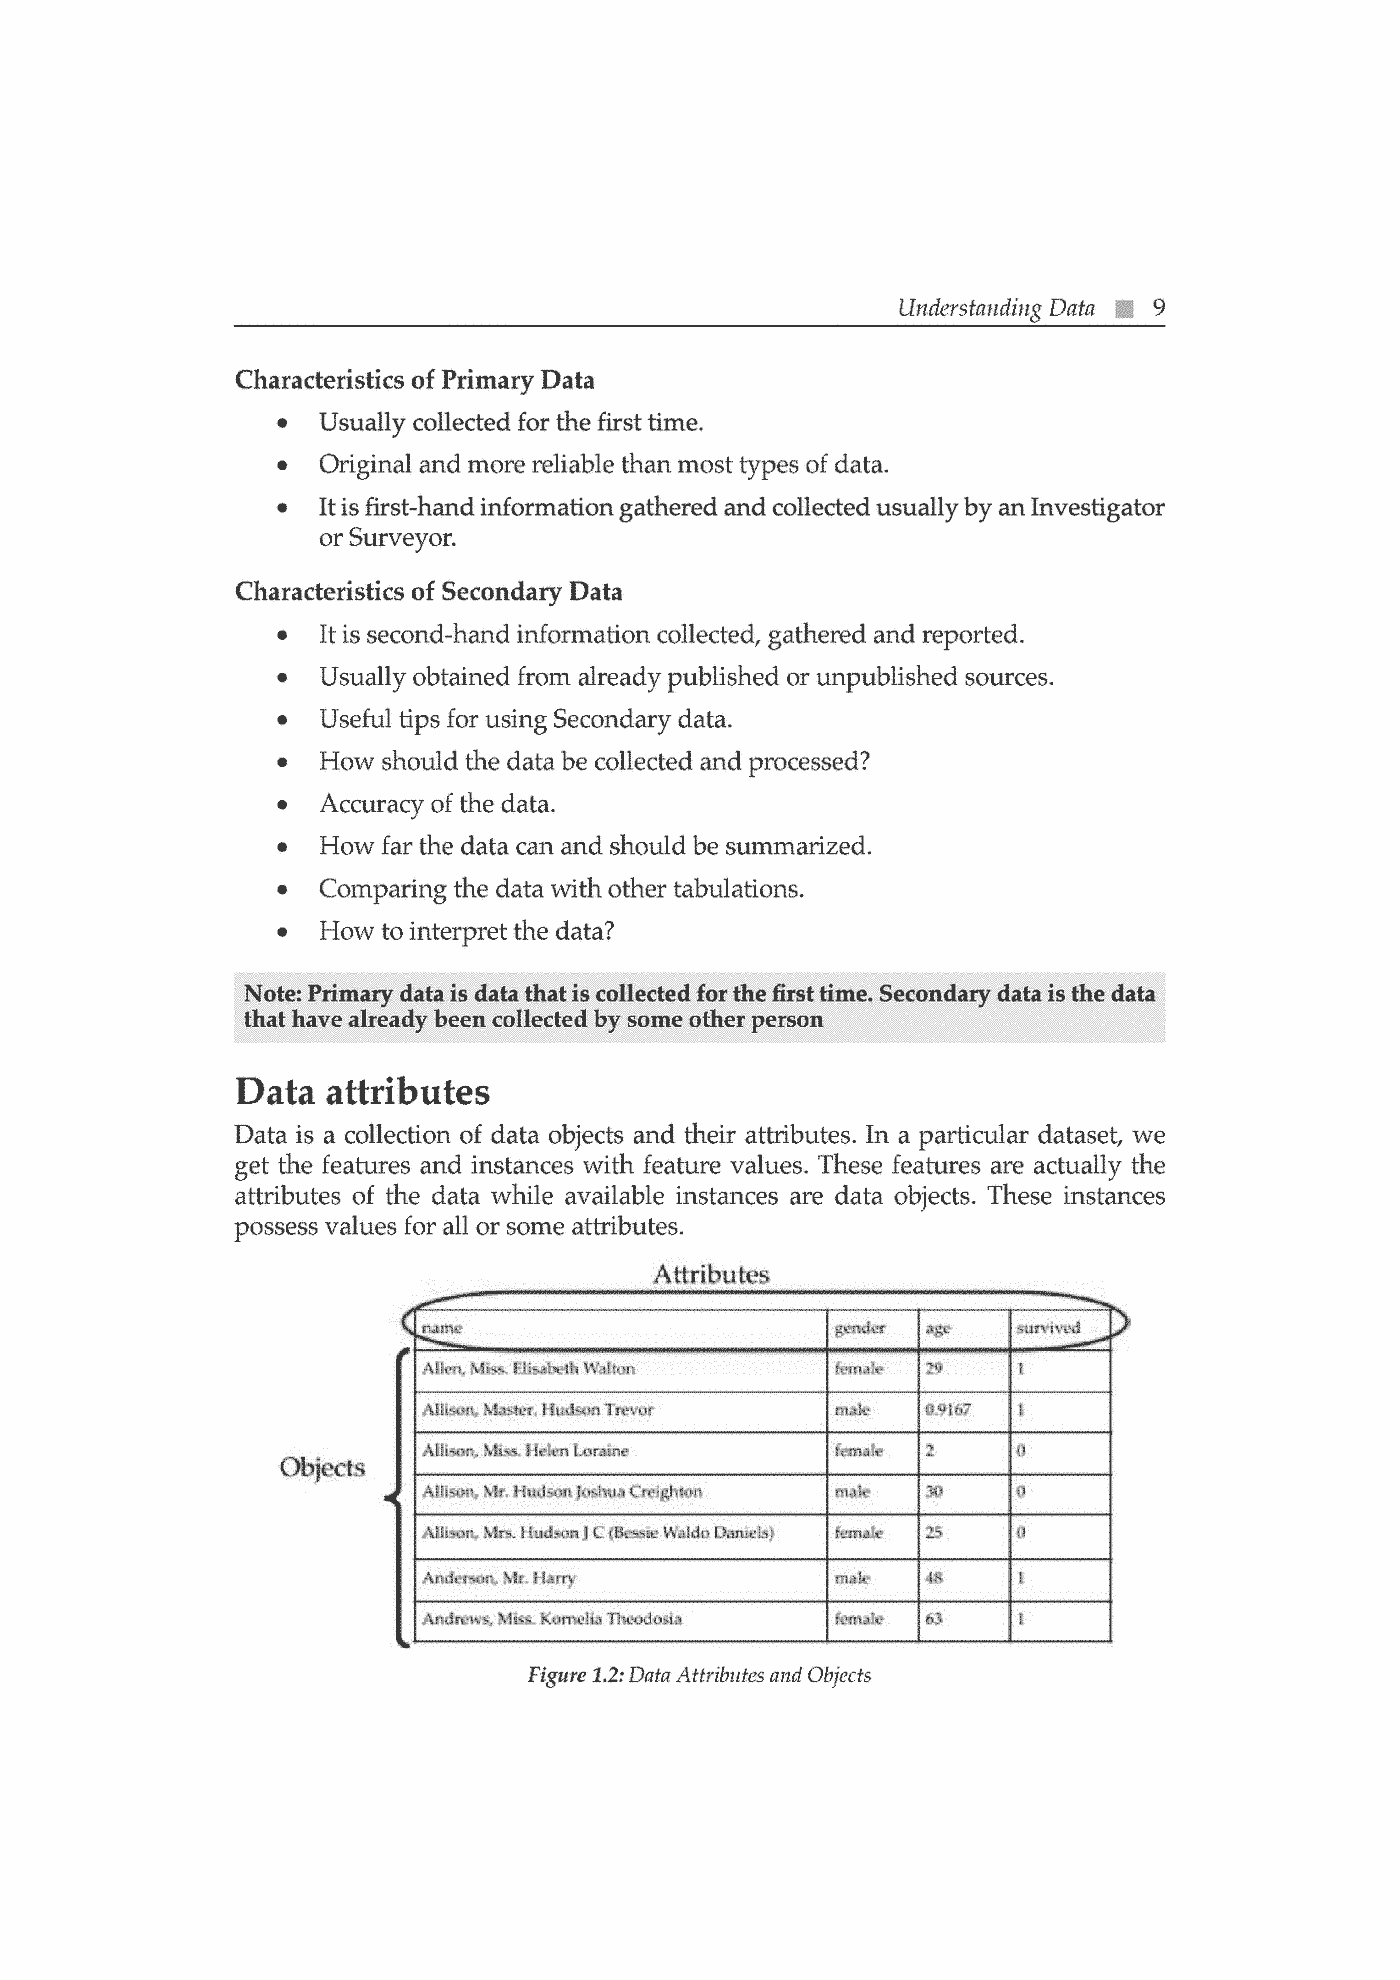
  • Fragment „Data Visualization with Python” — strona 4 z 304
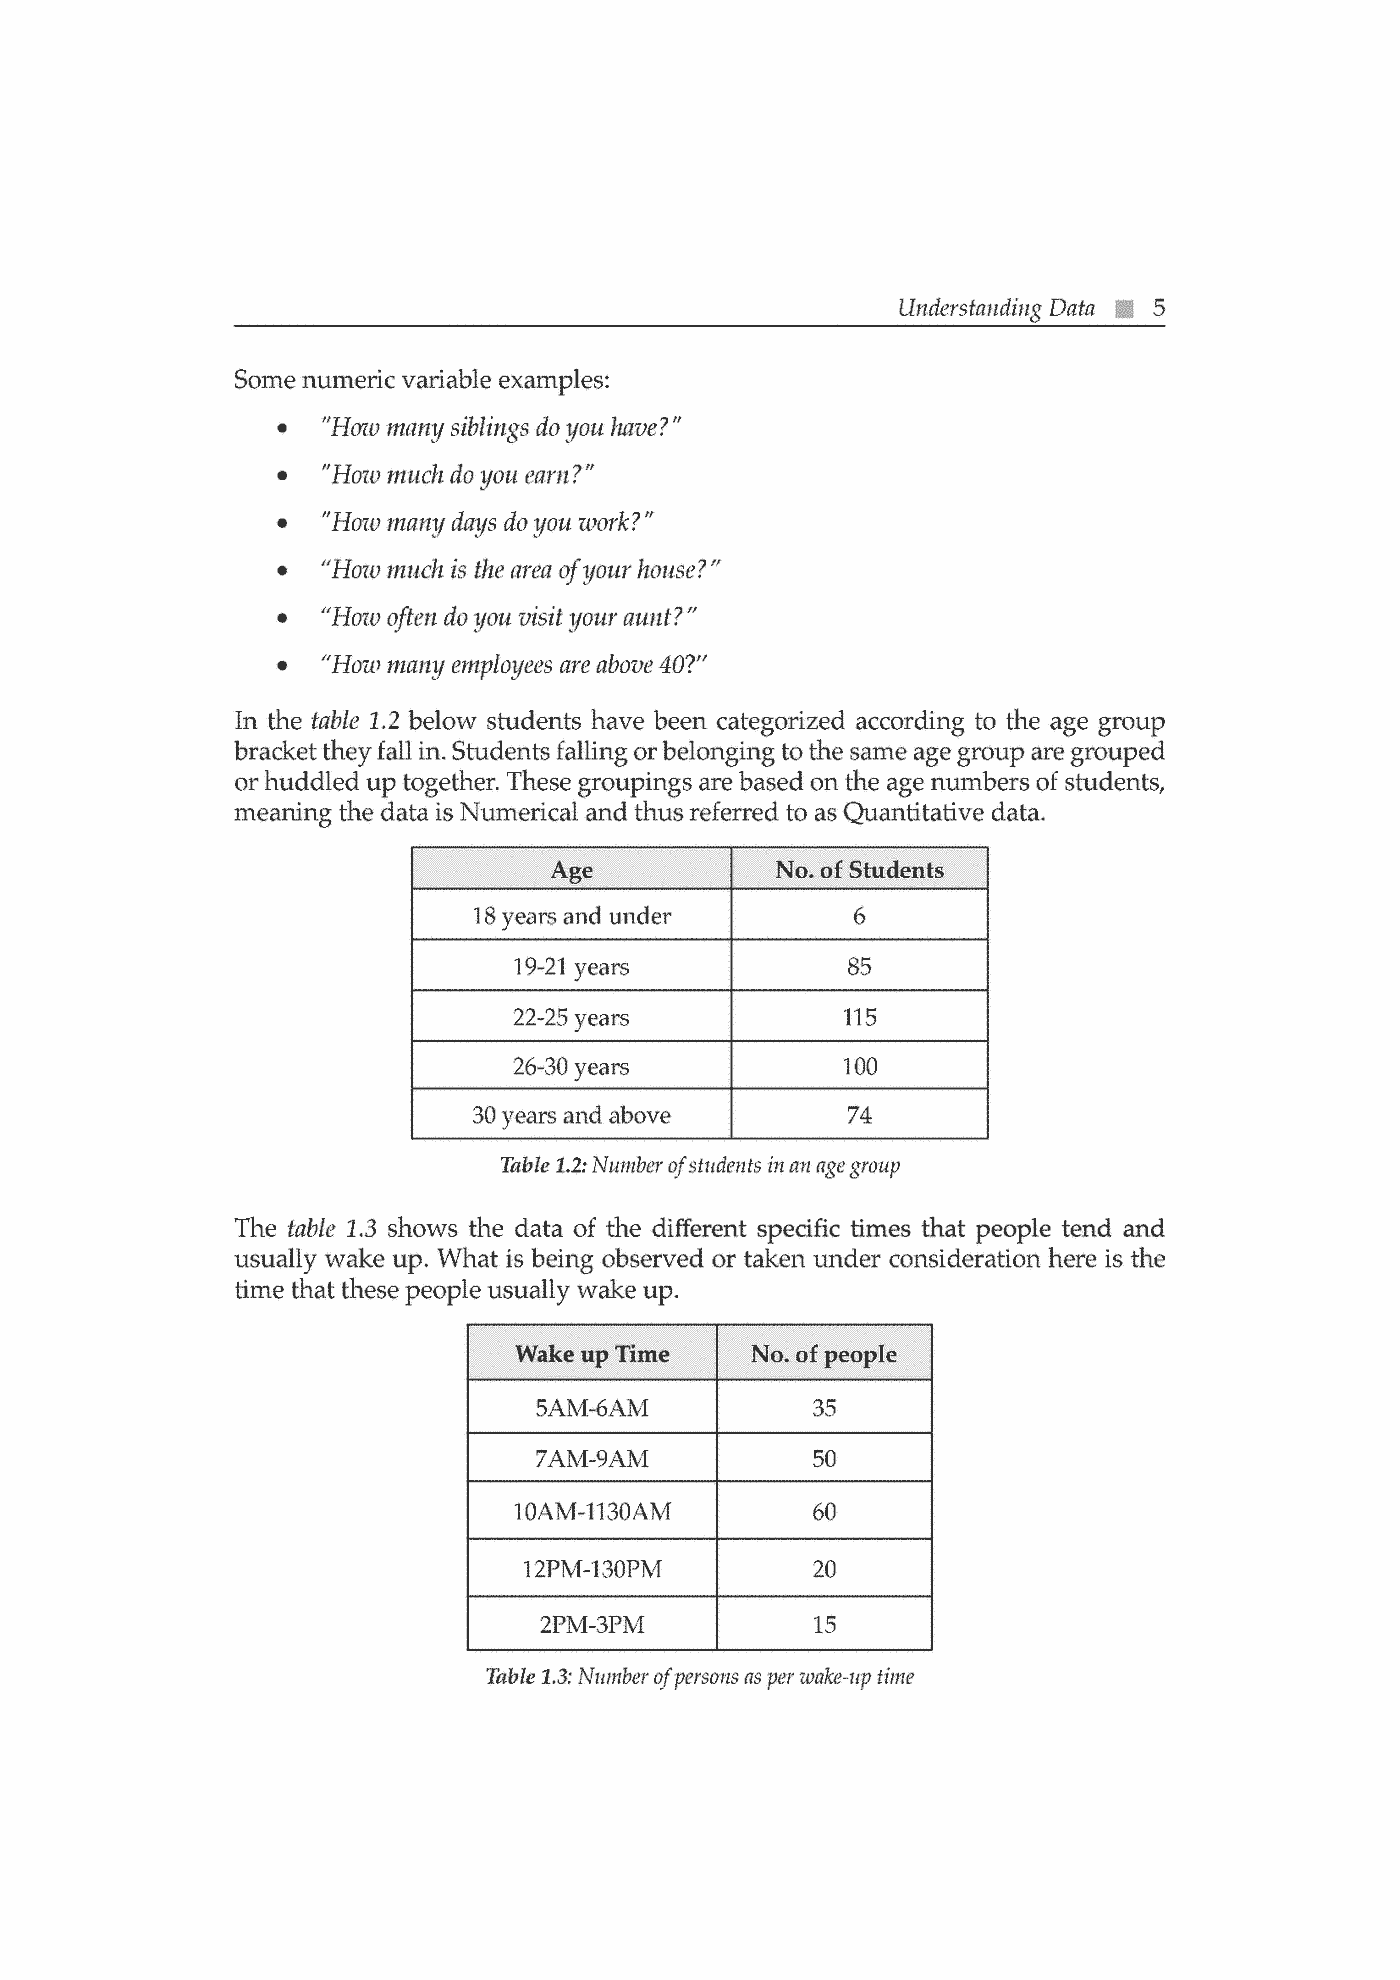
  • Fragment „Data Visualization with Python” — strona 5 z 305
  • Fragment „Data Visualization with Python” — strona 6 z 306
  • Fragment „Data Visualization with Python” — strona 7 z 307
  • Fragment „Data Visualization with Python” — strona 8 z 308
  • Fragment „Data Visualization with Python” — strona 9 z 309
  • Fragment „Data Visualization with Python” — strona 10 z 3010
  • Fragment „Data Visualization with Python” — strona 11 z 3011
  • Fragment „Data Visualization with Python” — strona 12 z 3012
  • Fragment „Data Visualization with Python” — strona 13 z 3013
  • Fragment „Data Visualization with Python” — strona 14 z 3014
  • Fragment „Data Visualization with Python” — strona 15 z 3015
  • Fragment „Data Visualization with Python” — strona 16 z 3016
  • Fragment „Data Visualization with Python” — strona 17 z 3017
  • Fragment „Data Visualization with Python” — strona 18 z 3018
  • Fragment „Data Visualization with Python” — strona 19 z 3019
  • Fragment „Data Visualization with Python” — strona 20 z 3020
  • Fragment „Data Visualization with Python” — strona 21 z 3021
  • Fragment „Data Visualization with Python” — strona 22 z 3022
  • Fragment „Data Visualization with Python” — strona 23 z 3023
  • Fragment „Data Visualization with Python” — strona 24 z 3024
  • Fragment „Data Visualization with Python” — strona 25 z 3025
  • Fragment „Data Visualization with Python” — strona 26 z 3026
  • Fragment „Data Visualization with Python” — strona 27 z 3027
  • Fragment „Data Visualization with Python” — strona 28 z 3028
  • Fragment „Data Visualization with Python” — strona 29 z 3029
  • Fragment „Data Visualization with Python” — strona 30 z 3030

Opis

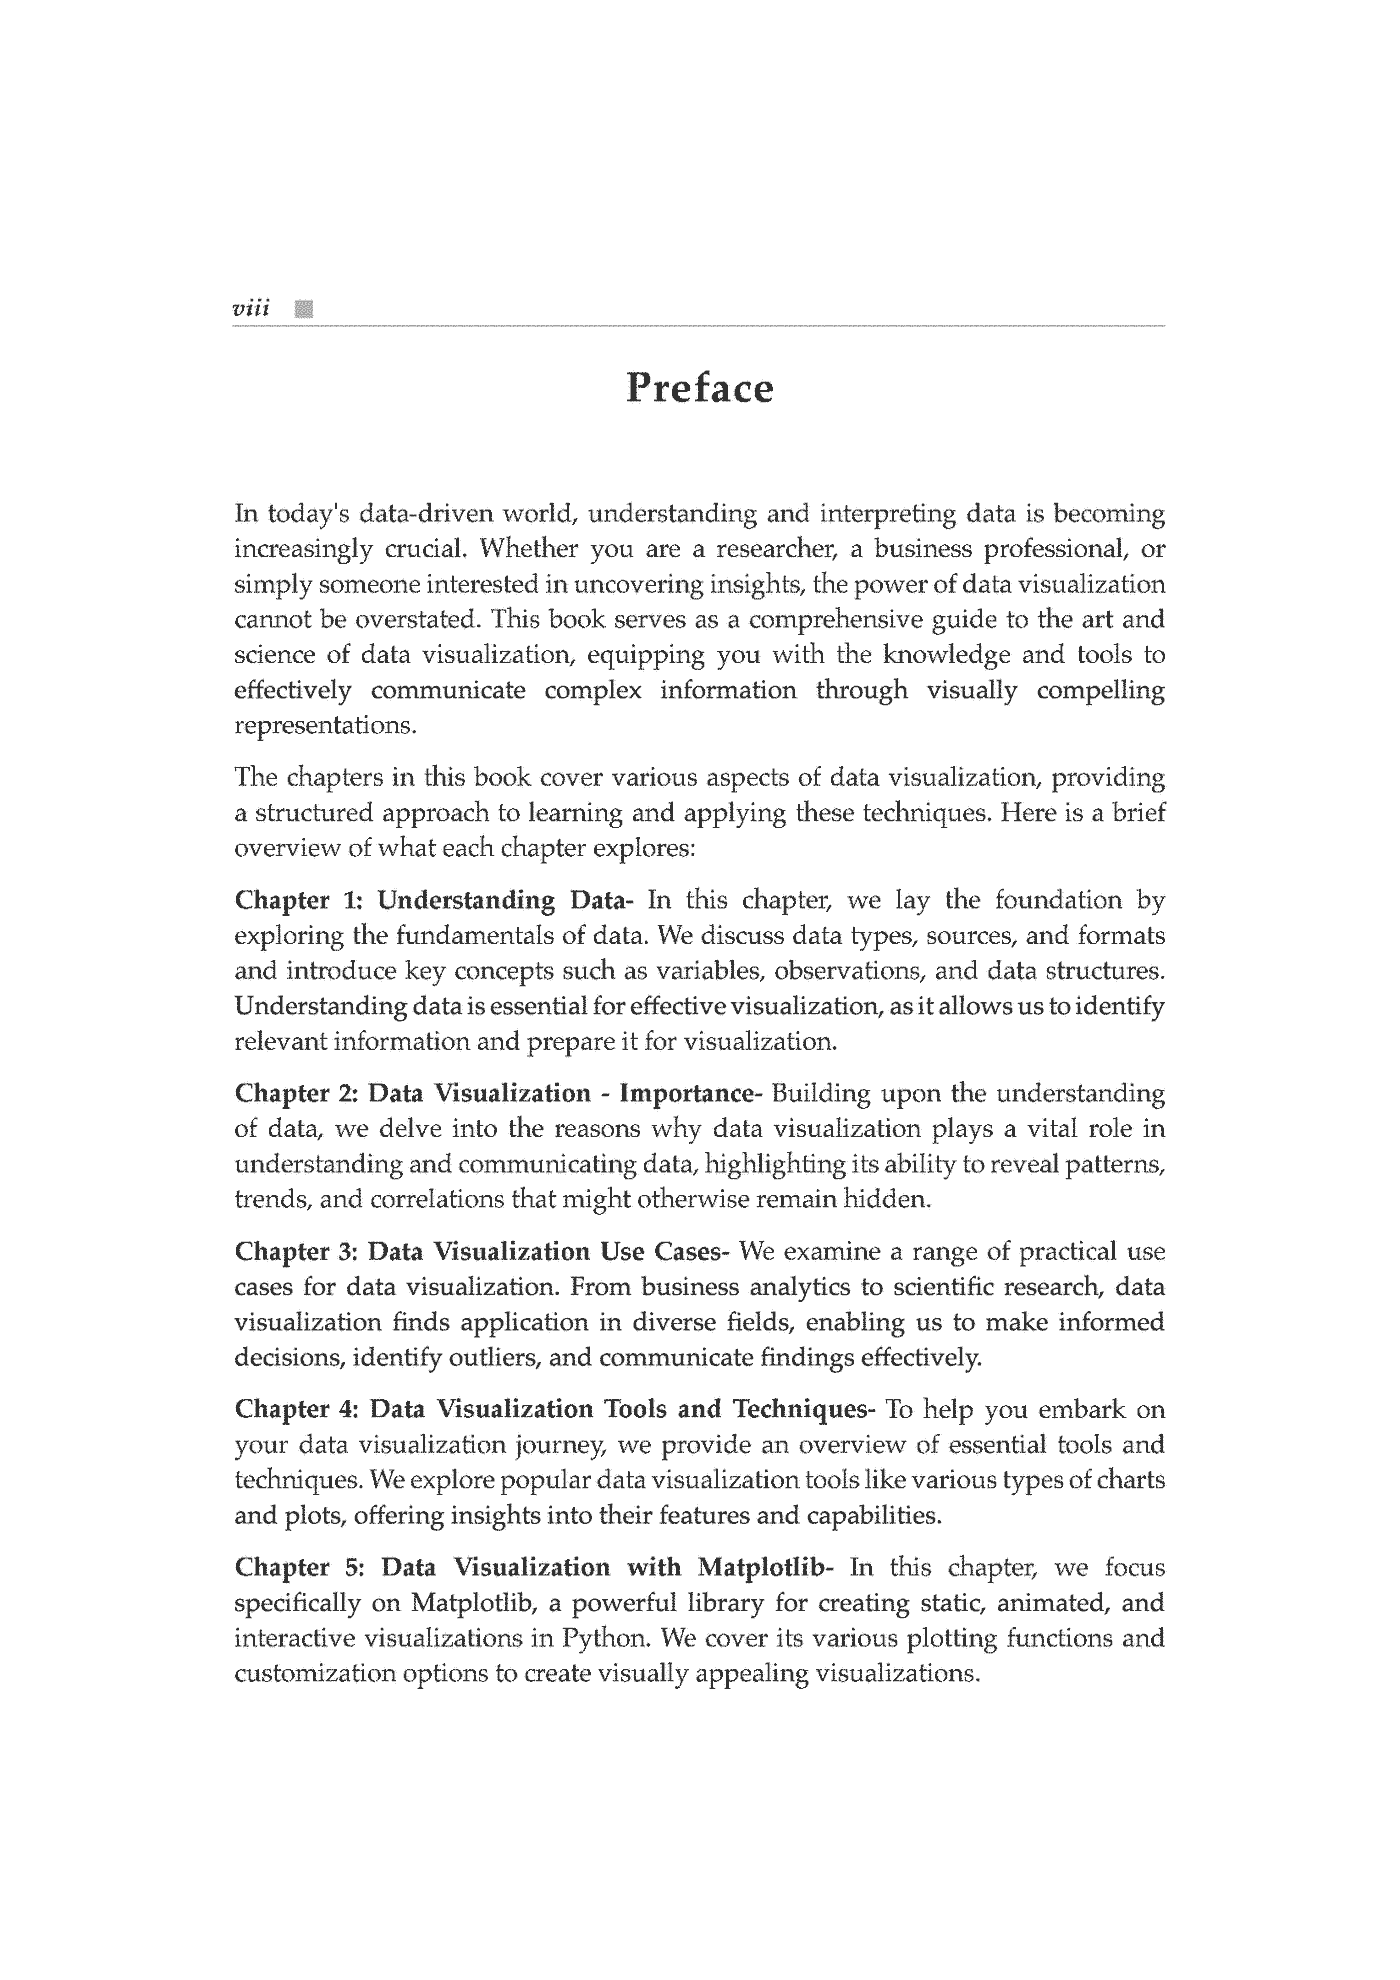
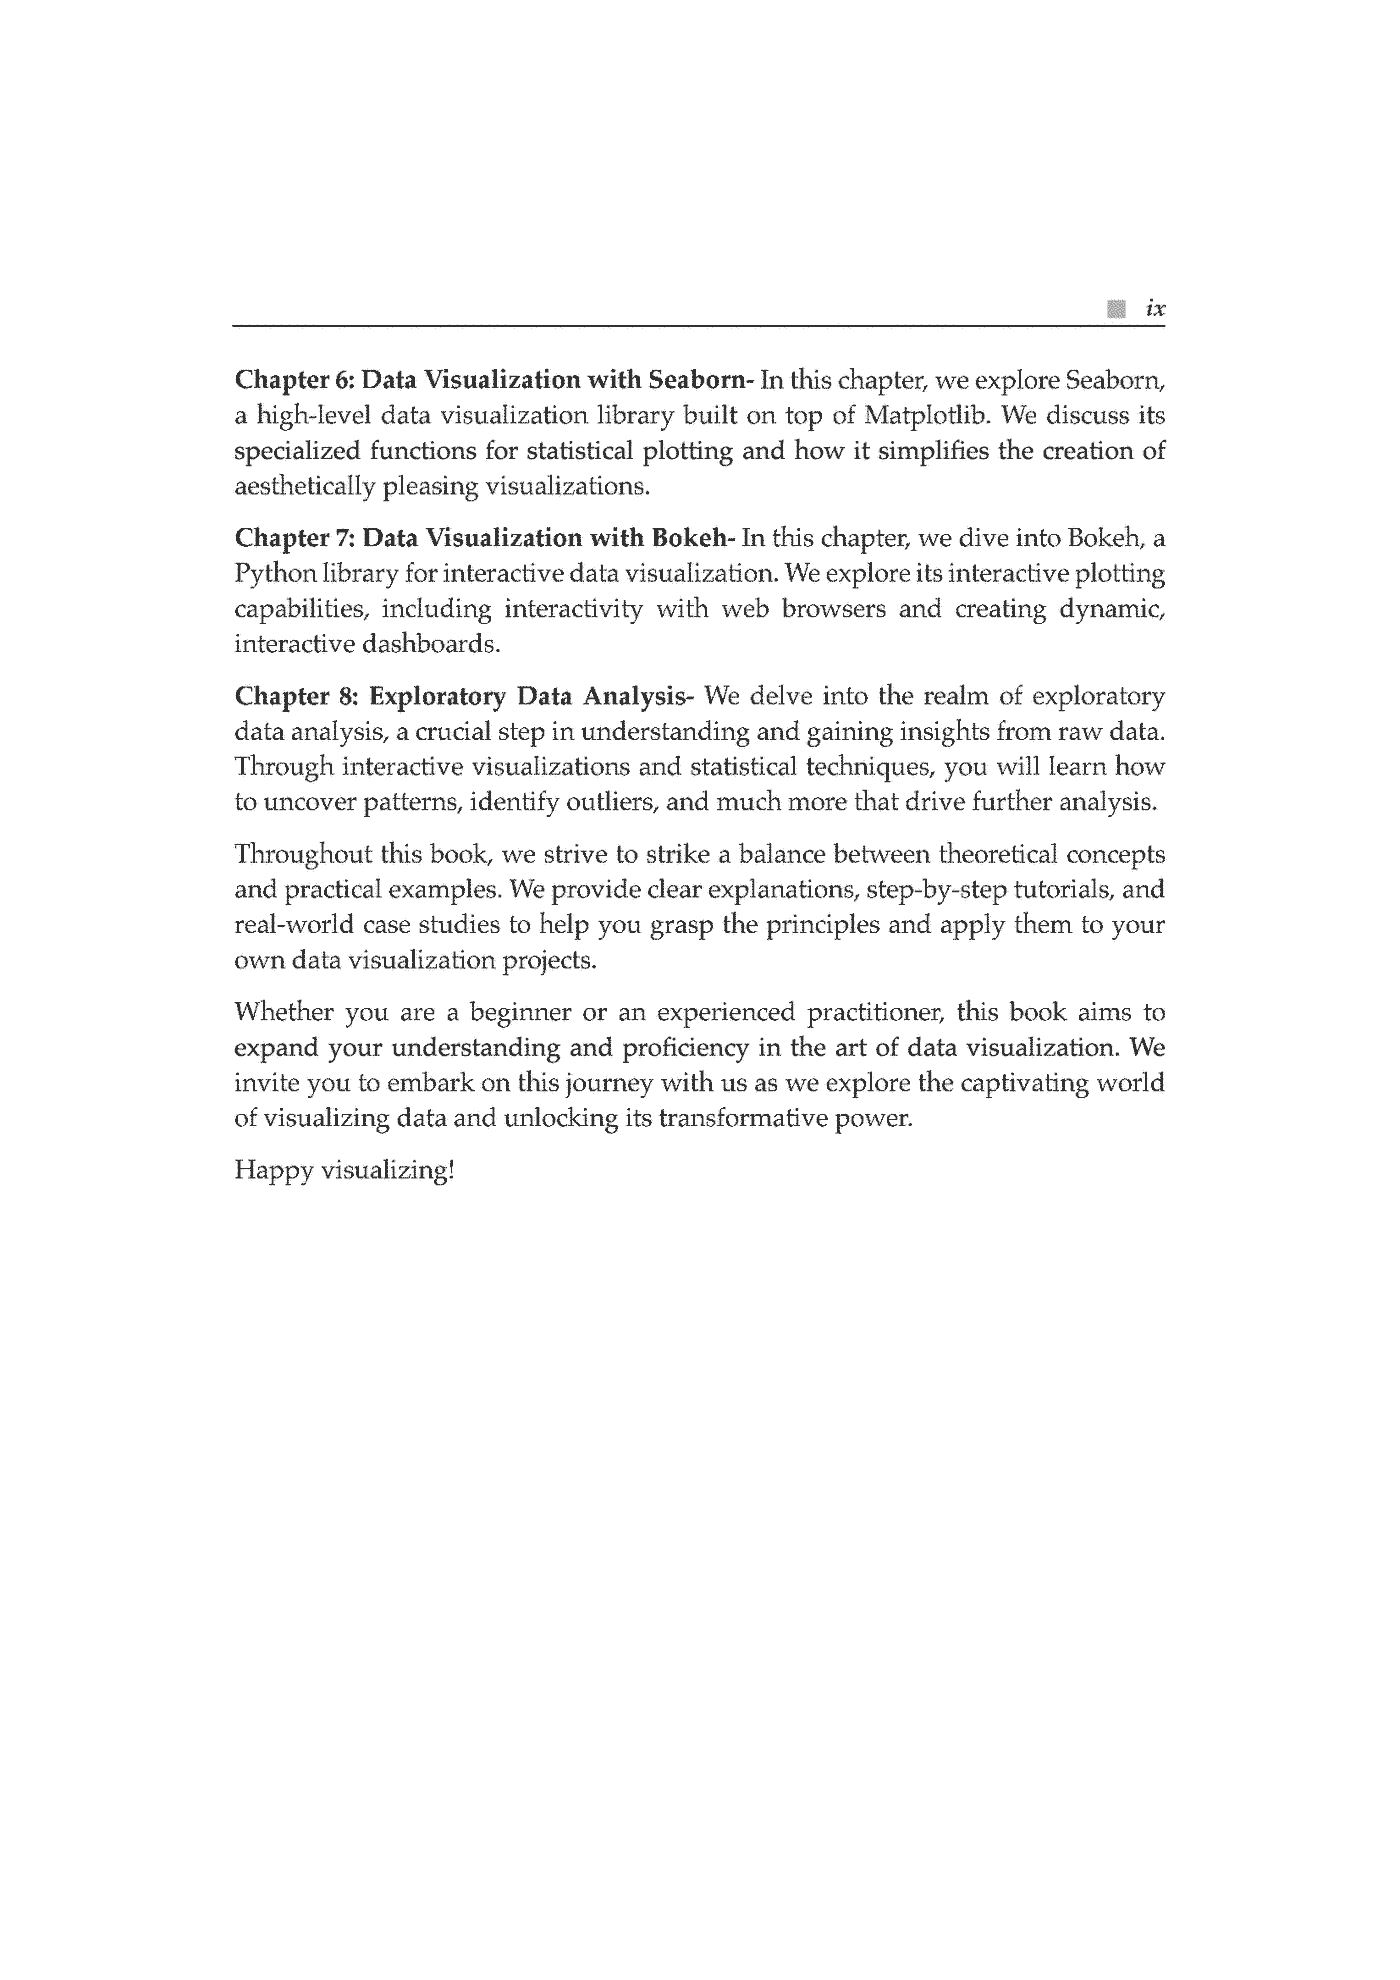
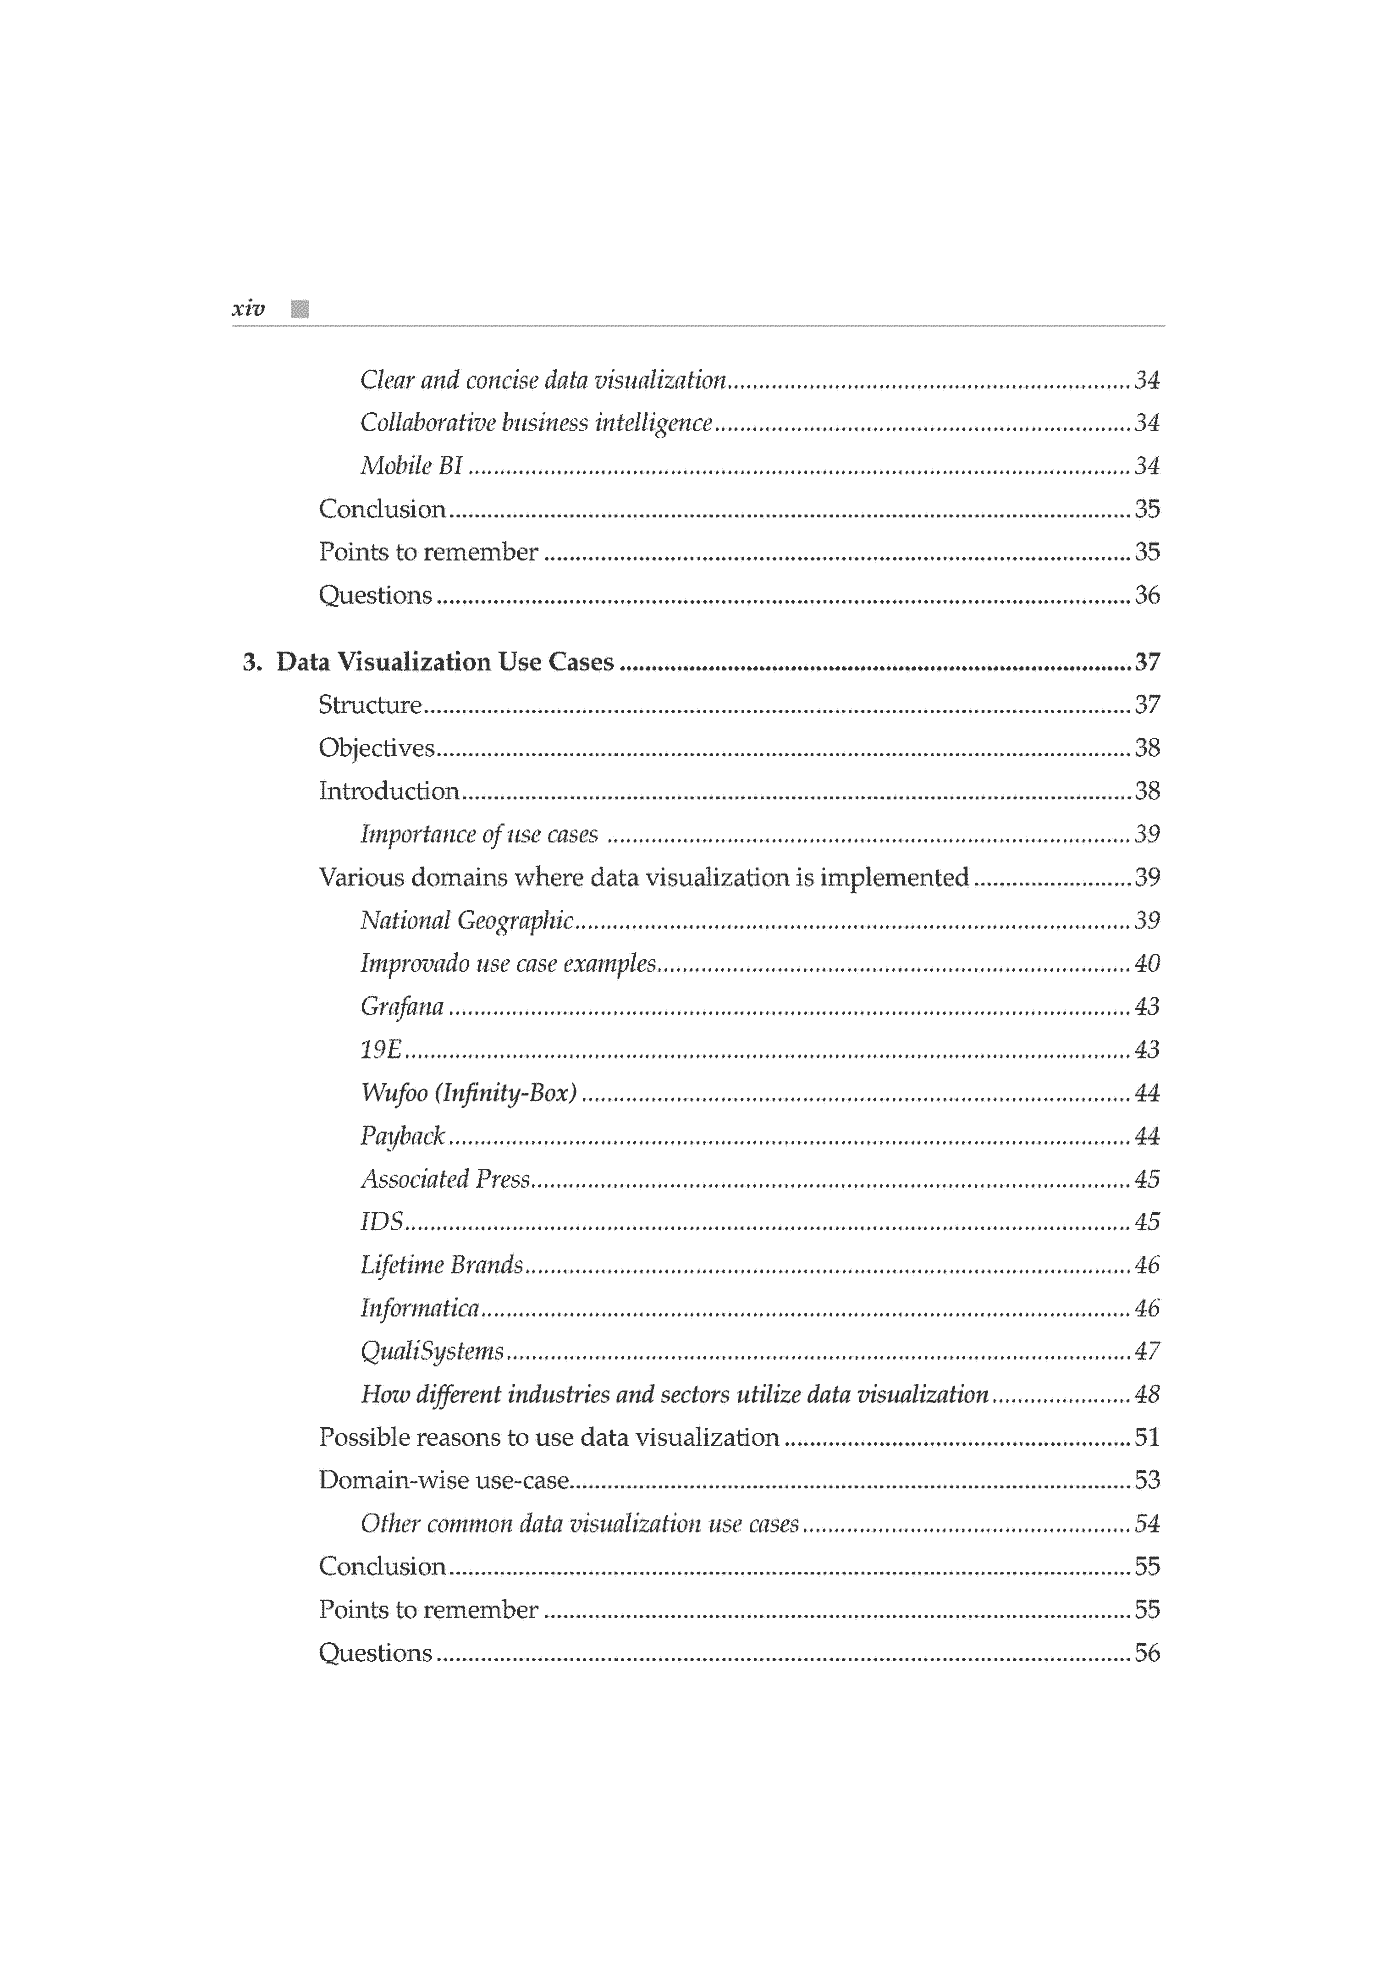
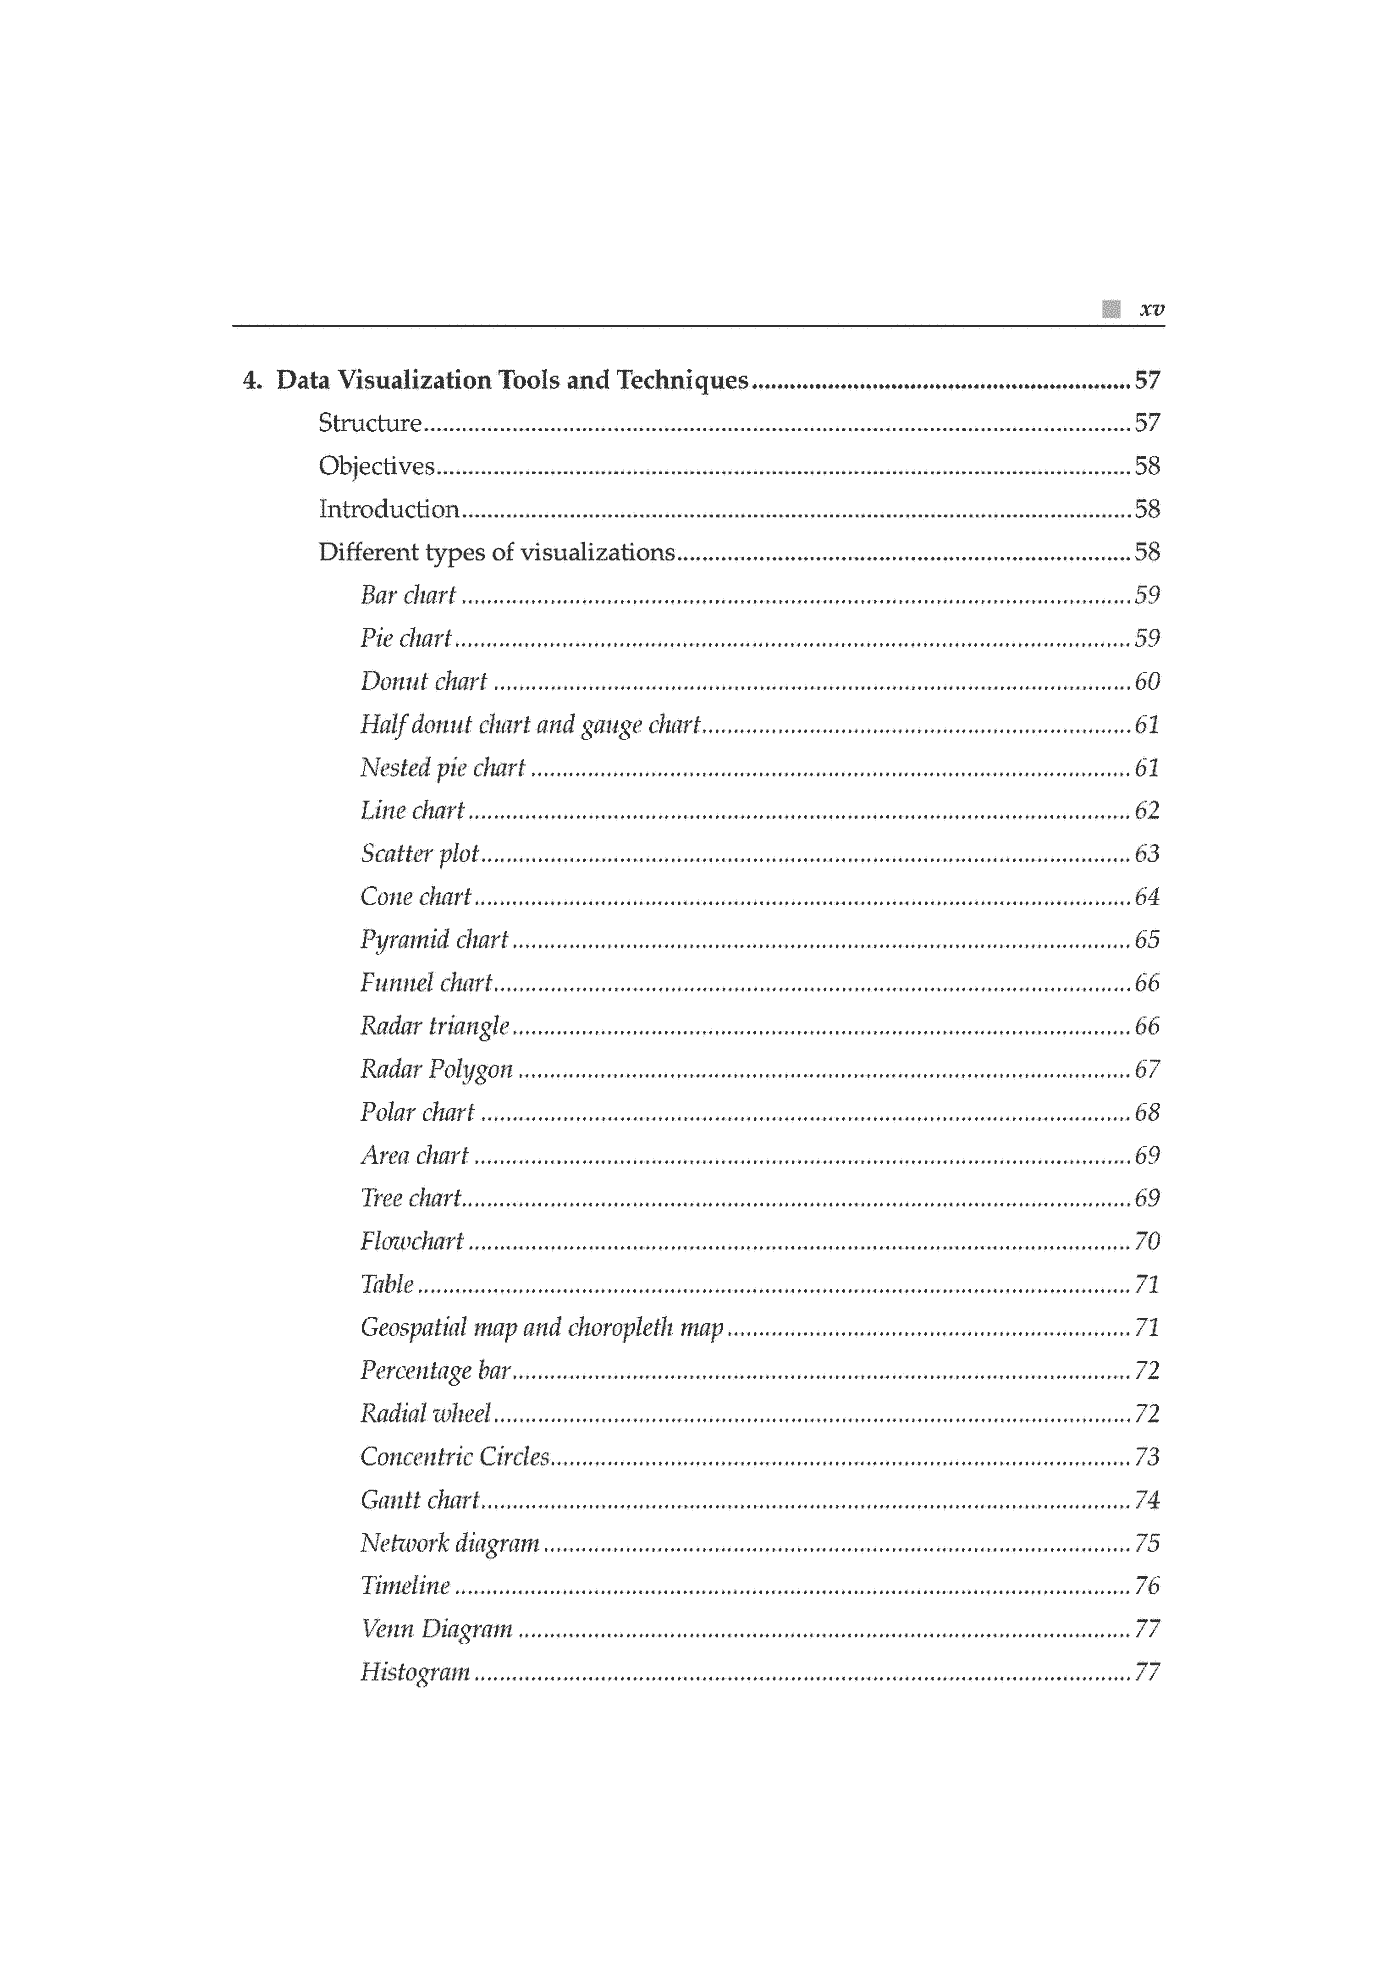
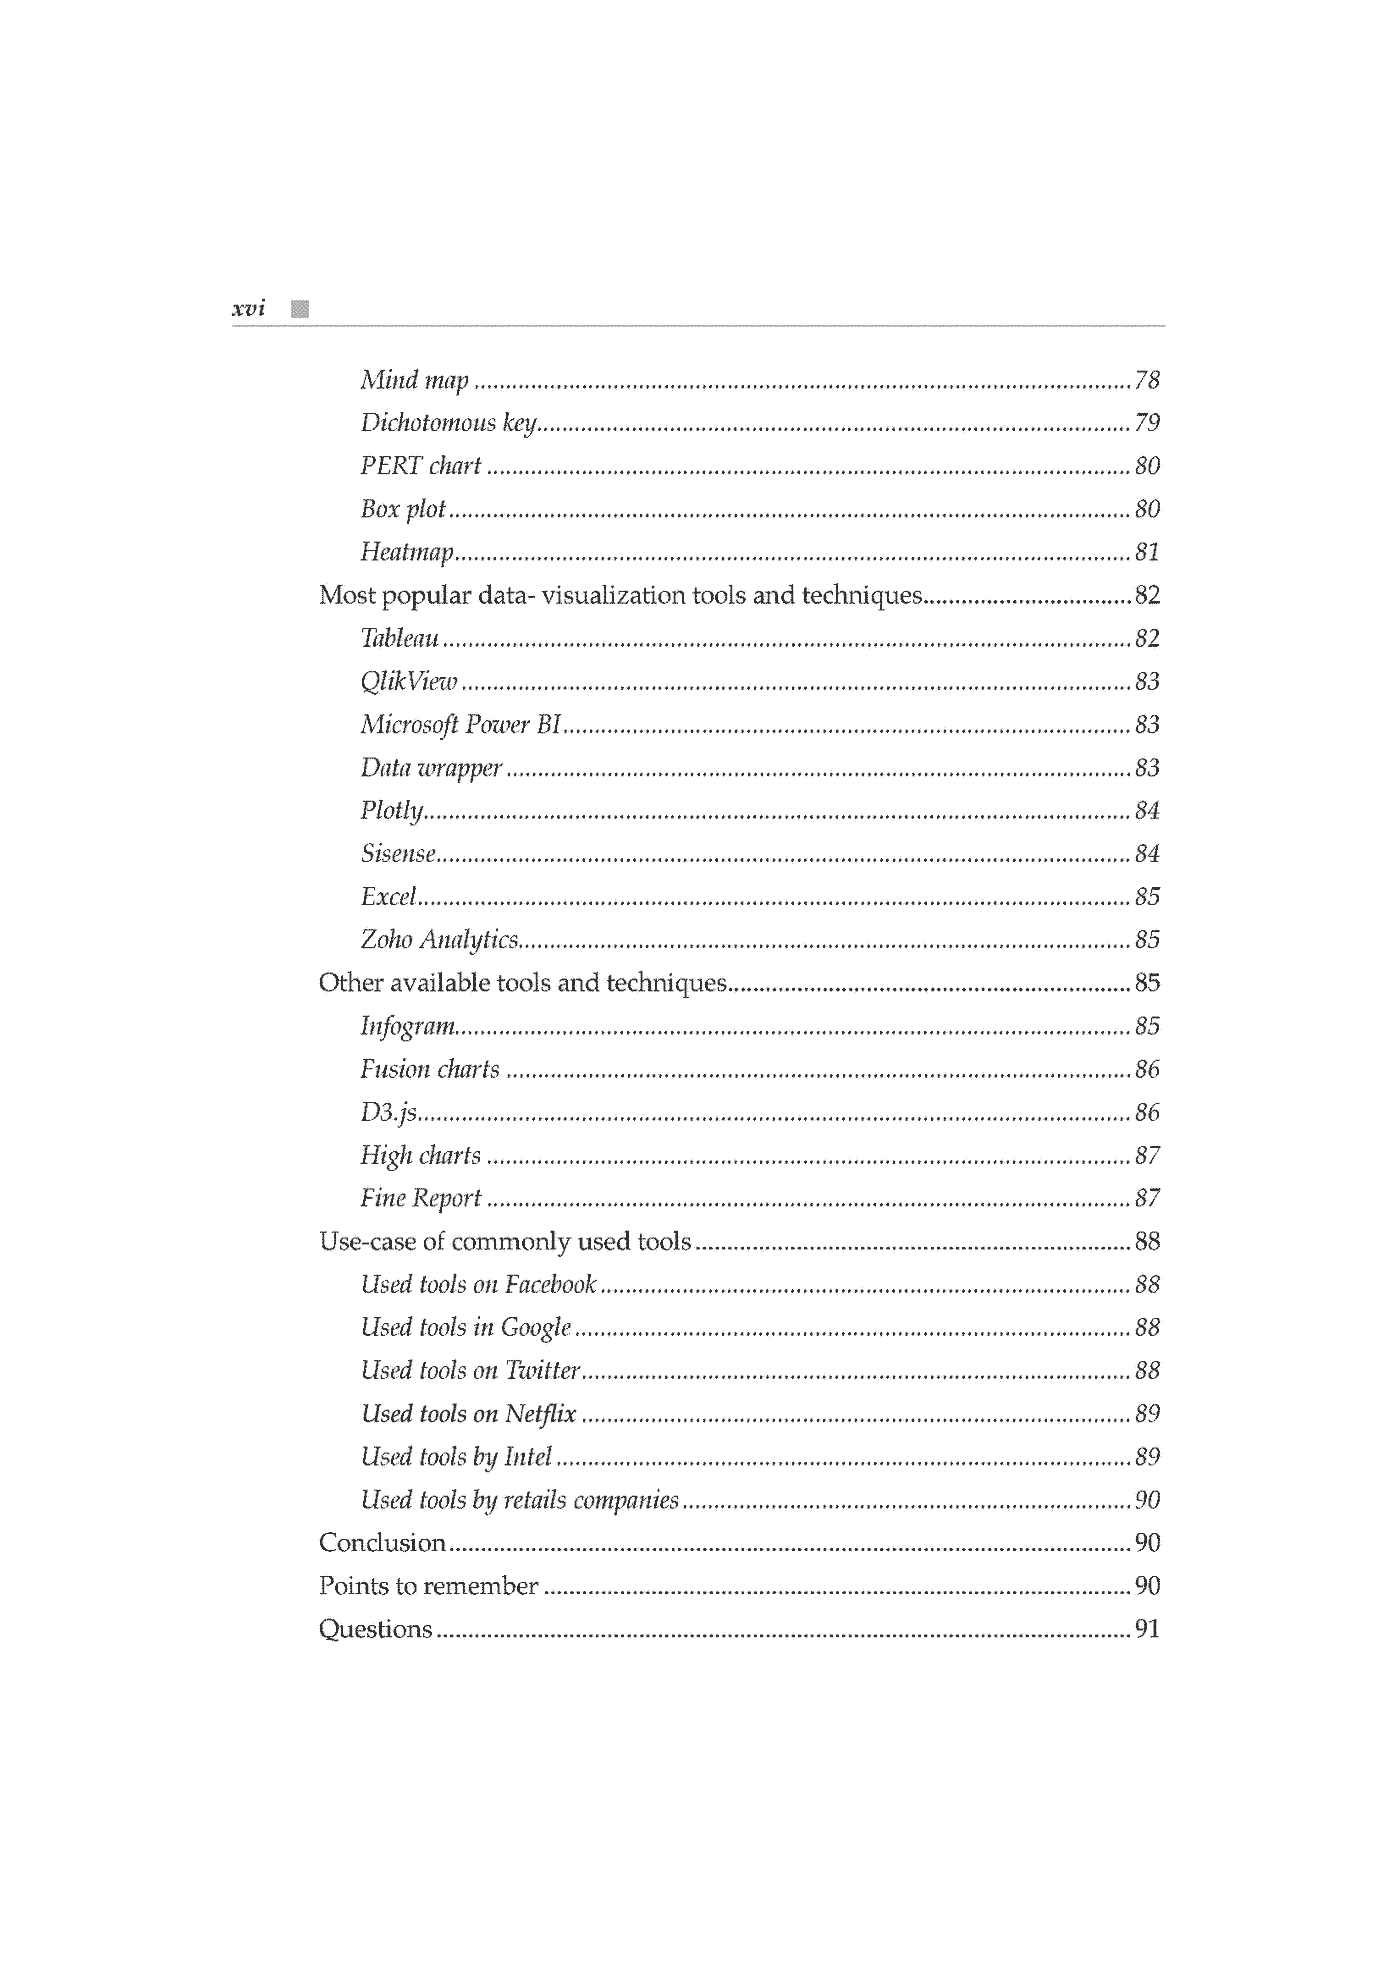
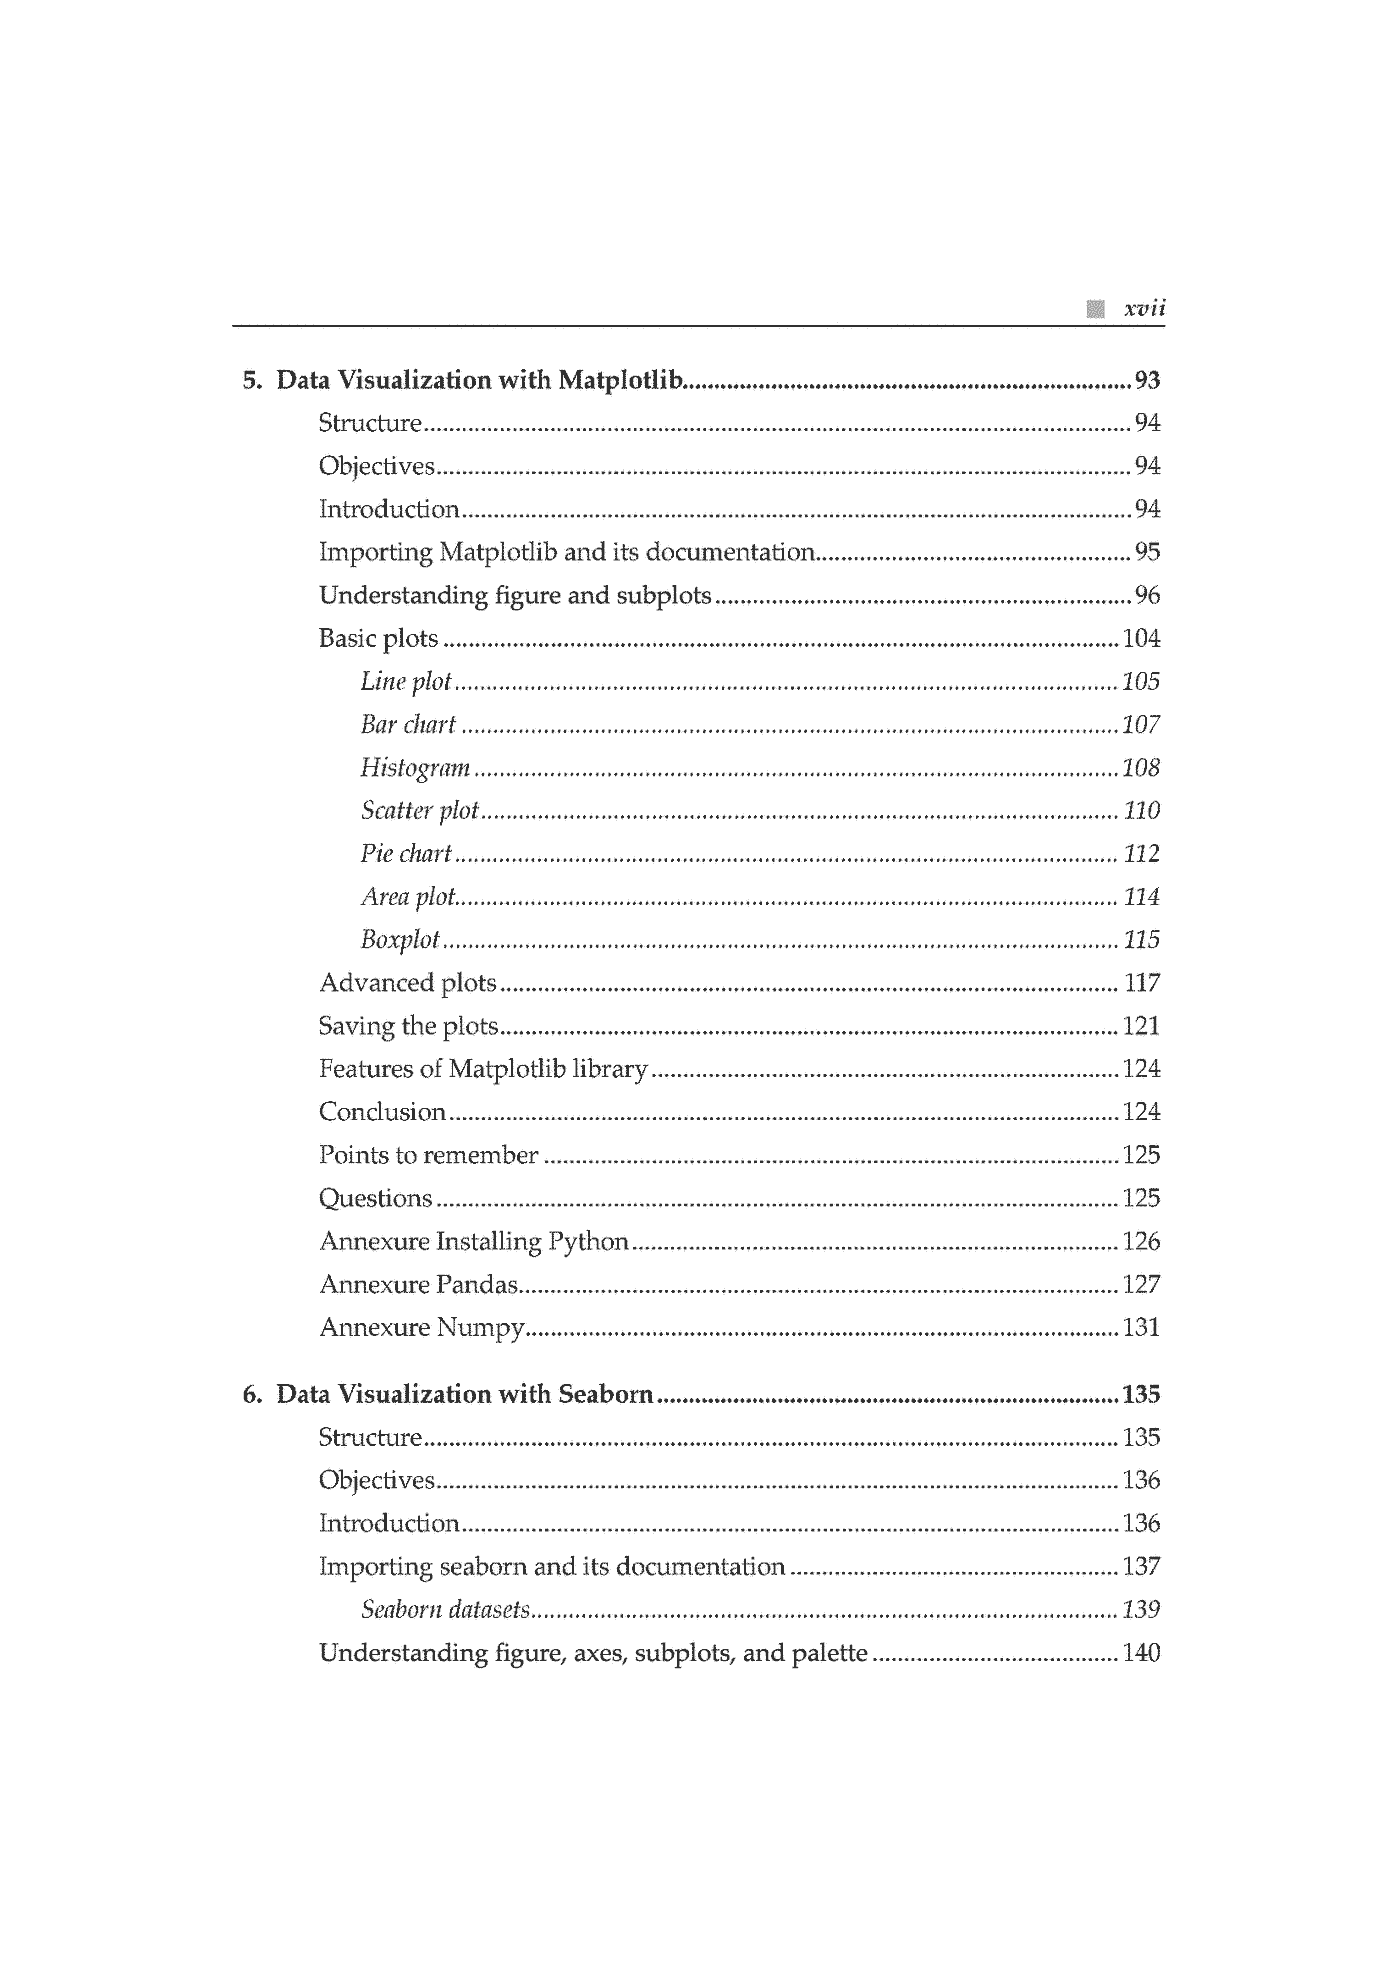
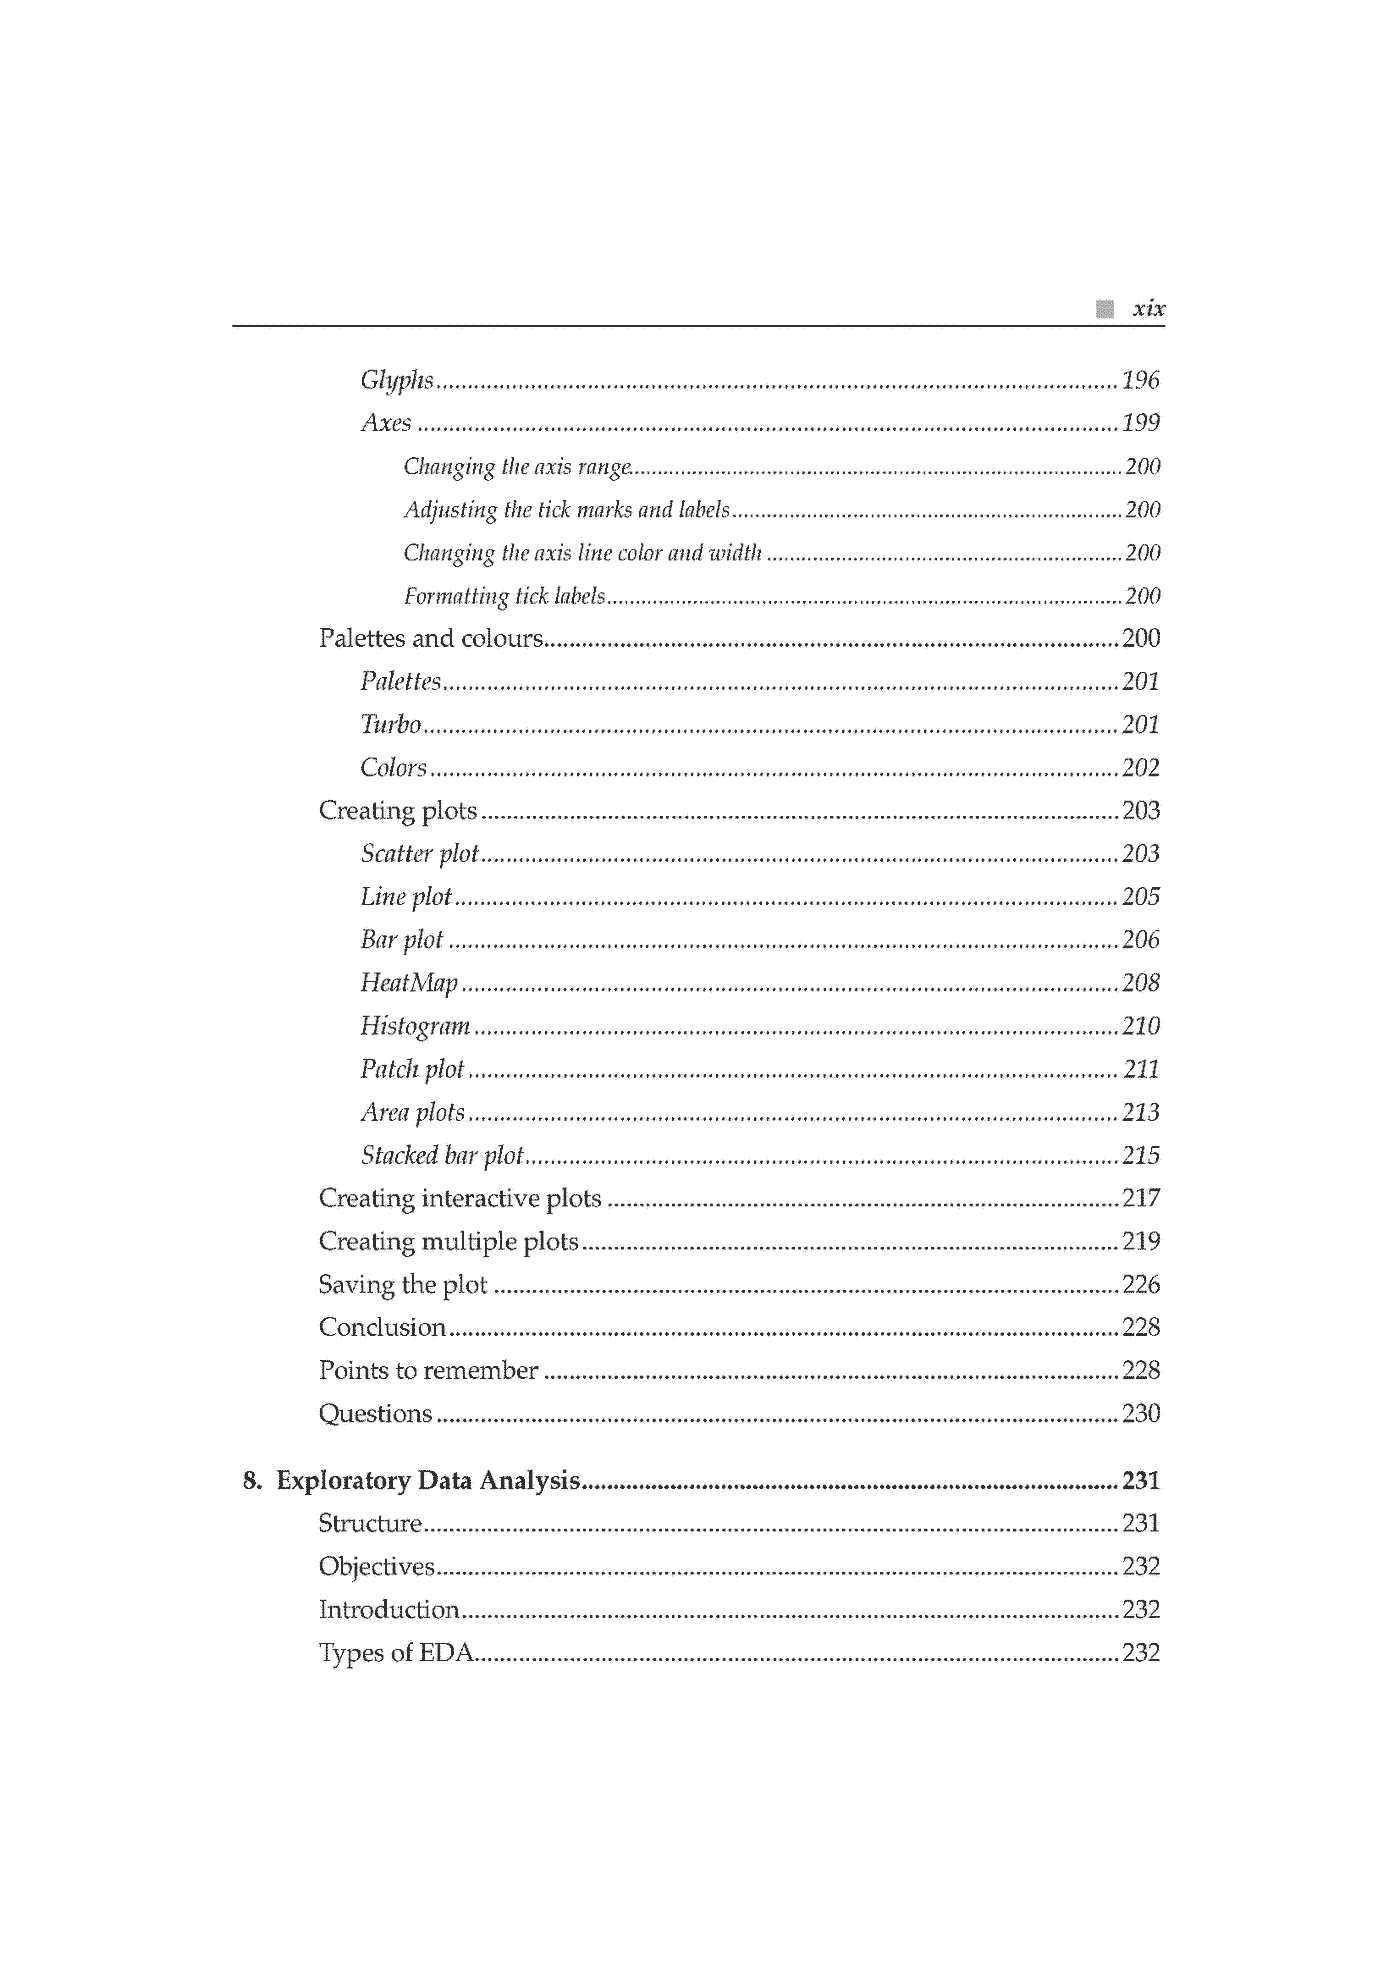
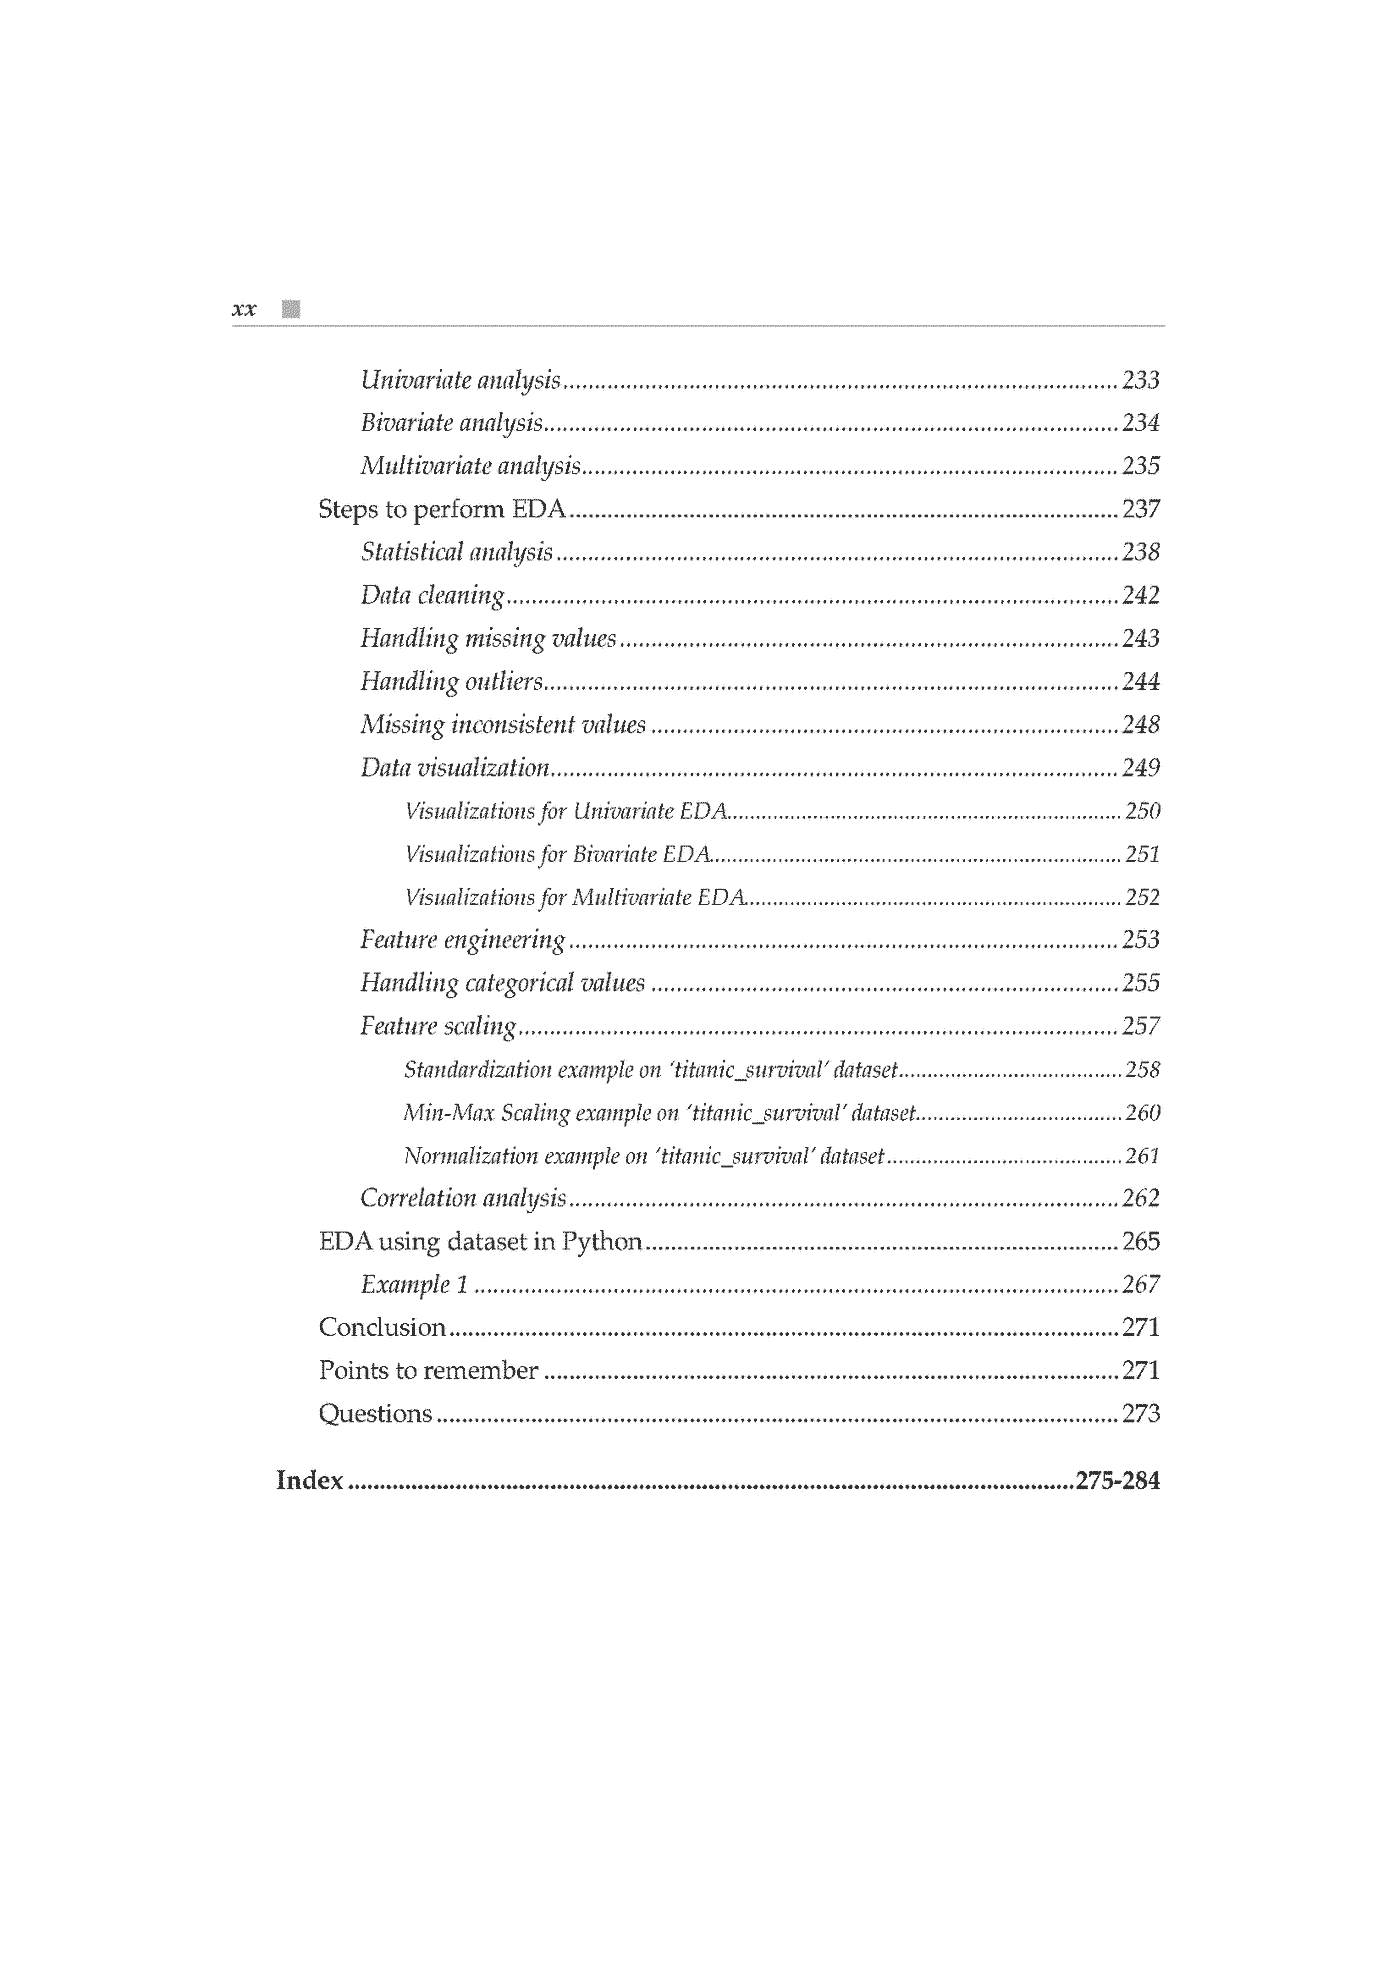
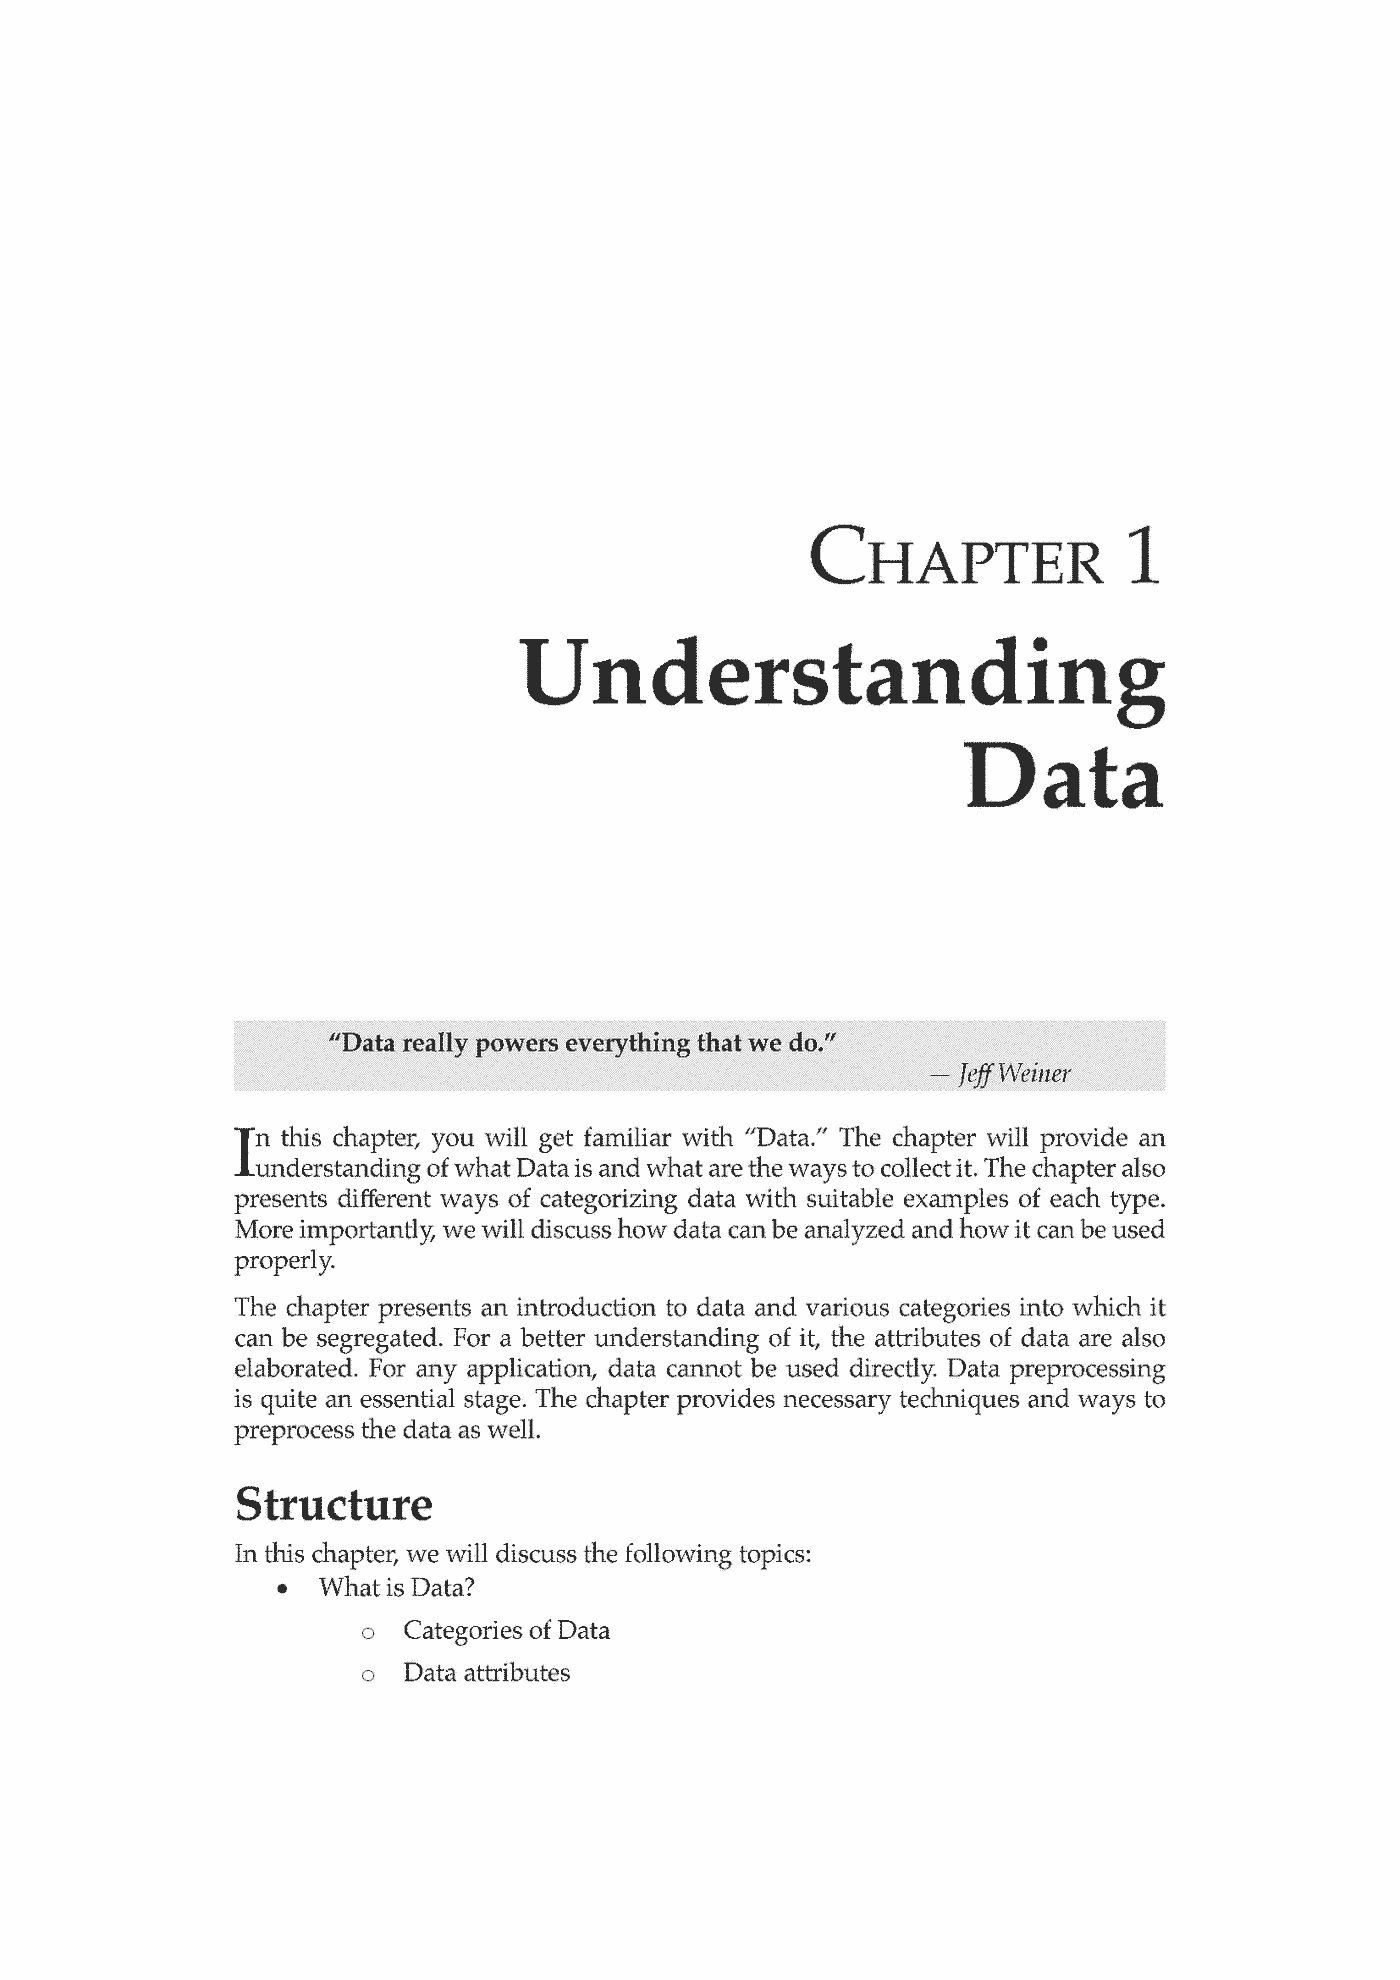
Transforming data into actionable insights using Python KEY FEATURES Gain a comprehensive understanding of data visualization and exploratory data analysis (EDA) using Python. Discover valuable insights and patterns in data through visual analysis. Master the art of effectively communicating complex concepts by creating compelling and impactful data visualizations. DESCRIPTION Python is a popular programming language for data visualization due to its rich ecosystem of libraries and tools. If you're interested in delving into data visualization in Python, this book is an excellent resource to begin your journey. With Matplotlib, you'll master the art of creating a wide range of charts, plots, and graphs. From basic line plots to complex 3D visualizations, you'll learn how to transform raw data into engaging visuals that tell compelling stories. Dive into Seaborn, a high-level library built on top of Matplotlib, and discover how to effortlessly create beautiful and informative statistical visualizations effortlessly. From heatmaps to distribution plots, you'll unleash the full potential of Seaborn in your data analysis endeavors. Lastly, you will learn how to unleash the true potential of Bokeh and create compelling data visualizations that allow users to explore and interact with data dynamically. By the end of the book, you will have acquired the knowledge and skills necessary to create a diverse range of visualizations proficiently. WHAT YOU WILL LEARN Utilize Matplotlib, Seaborn, and Bokeh to produce visually captivating visualizations. Gain expertise in various types of charts, plots, and graphs. Craft visually appealing and informative statistical visualizations. Construct interactive and adaptable plots using Bokeh. Explore various techniques for conducting Exploratory Data Analysis (EDA). WHO THIS BOOK IS FOR This book caters to a wide audience, including undergraduate and postgraduate students, researchers, data managers, and data analysts. It presents an all-encompassing exploration of data visualization, equipping you with the essential groundwork to progress as a data-driven professional. TABLE OF CONTENTS 1. Understanding Data 2. Data Visualization Importance 3. Data Visualization Use Cases 4. Data Visualization Tools and Techniques 5. Data Visualization with Matplotlib 6. Data Visualization with Seaborn 7. Data Visualization with Bokeh 8. Exploratory Data Analysis
Linki do księgarni są linkami partnerskimi Grupy Helion i Księgarni PWN (przez sieć Adtraction). Ceny i dostępność pochodzą z oferty wydawcy i mogą się zmienić.